

Start and Use the Fabasoft app.telemetry Client
The Fabasoft app.telemetry web browser client will be automatically installed with the Fabasoft app.telemetry server setup in the virtual directory /apptelemetry/.
You can access Fabasoft app.telemetry with your web browser: |
The URL for the Fabasoft app.telemetry web browser client has the following format:
- For normal HTTP-connection: http://<server-IP>/apptelemetry/
- For secure TLS-connection: https://<server-IP>/apptelemetry/
The virtual directory is by default “apptelemetry” as set up by the installer.
After these settings have been applied a startup infrastructure monitoring the Fabasoft app.telemetry server itself is loaded.
Configuration of Infrastructure
To configure applications, services, service checks and other parameters you have to switch the client to the infrastructure “Configuration” page by using the “Configuration” button from the view menu.
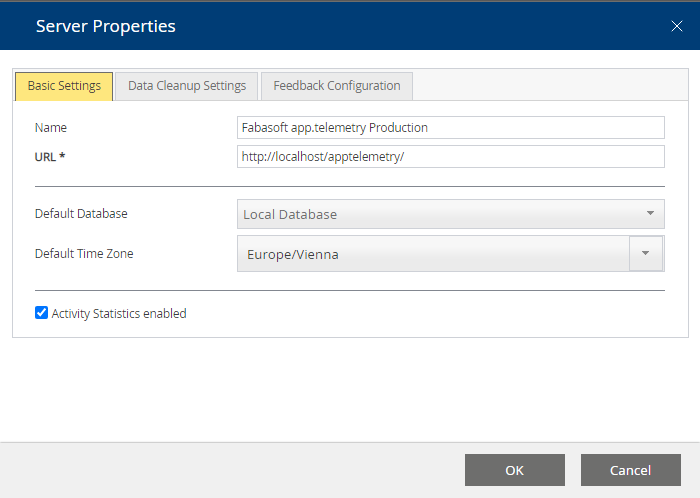
First of all you should configure some basic server properties by means of opening the edit dialog for the “Server Settings” object:
- The “Name” will be used as window title in the web browser and can be used to separate different app.telemetry installations more easily.
- The “URL” should include the full qualified host name of the app.telemetry server by which the installation can be reached from every client, because this URL is also used for some direct links to the installation (e.g. in notification e-mails).
- The “Default Database” is used everywhere where no specific database can be selected (e.g. form feedbacks, counter state history)
- The “Default Timezone” is used for this installation as base time zone.
- The “Activity Statistics enabled” checkbox activates the Inspect Activity Statistics feature.

The Data Cleanup Settings help you to manage the data size of the app.telemetry Server.
Software-Telemetry data is persisted on disk. Make sure to set “Data Expiration (days)” appropriate to allow users to analyze their requests and to limit the size of the data to fit the disk volume. On limited volumes you may even provide a “Data Size Limit (GB)” to remove data even faster e.g. in heavy load situations.
Activity Statistics are aggregated on disk and are intended to be be kept longer than raw telemetry data to provide long term load statistics of your systems. These data are independent of the Software-Telemetry data. You may limit the available data pool by either setting a “Data Expiration (days)” value or a “Data Size Limit (GB)”.
Fabasoft app.telemetry automatically records a history of status changes of all counters on the default database. Set the “Data Expiration (days)” property to limit the amount of data stored.
With each counter check you can configure to record data in a database. Set the “Data Expiration (days)” property to automatically delete old status values. This is a global setting, which is applied to all counters.
Counter data is being kept in memory of the Fabasoft app.telemetry Server process to provide faster response drawing your counter charts. Limit the amount of data using the “Data Online Timeout (hours)” property to the duration required. To implement charts covering longer intervals (> 6 hours) persist the counter data on database and the database will provide the values.
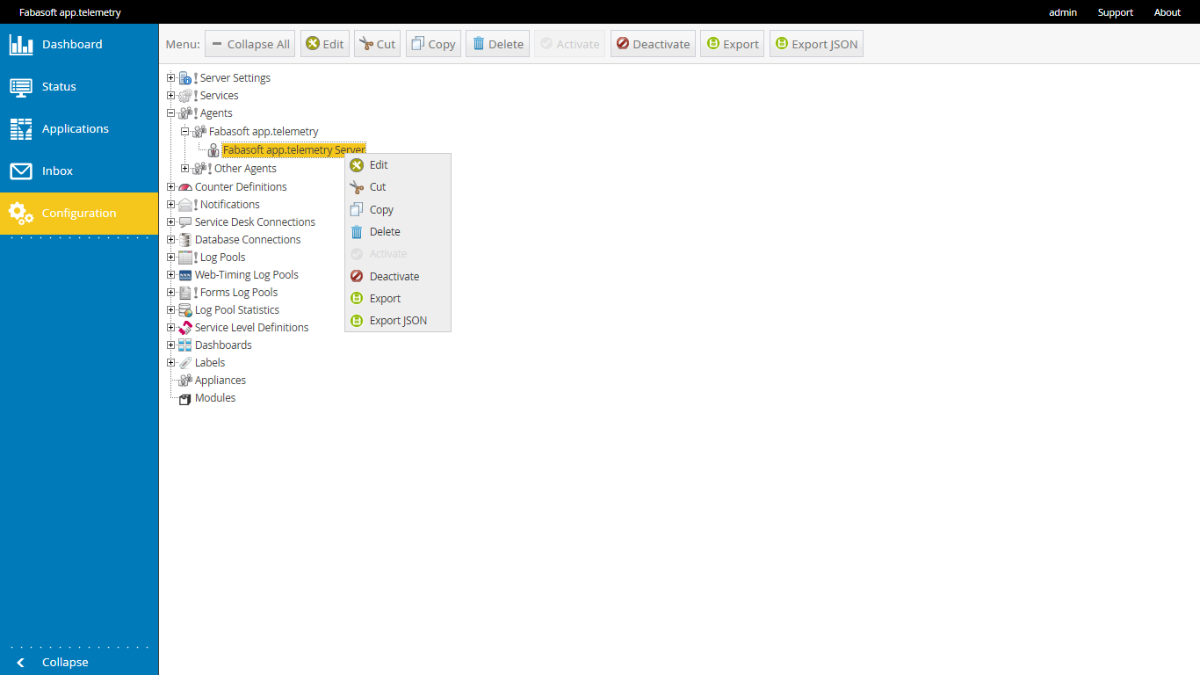
Generally the infrastructure objects support the following actions to be accessed on any selected infrastructure object via a context menu which opens on right mouse click:
- Edit: all elements (except the root elements) can be edited in element-specific edit dialogs opened after this action is clicked.
- New … Create a new object below the current selection.
- Cut: the currently selected object and store it in the clipboard.
- Copy: Store the currently selected object in the clipboard.
- Paste: Paste the object from the clipboard below the current selection (as child object).
- Delete: Delete the currently selected object and all children.
Note: any object depending on the current to be deleted object will be also deleted (a warning message will list all the affected objects)
Note: With Winter Release 2012 a multi-selection was introduced which makes the configuration much easier. Just keep the CTRL-key pressed during selection of elements to select more than one element of the same type (in the same container – with same parent). You can “cut”, “copy”, “paste” and “delete” multiple elements (do not release the CTRL-key before pressing the action button).
Creating Agents
The first step is to add the Fabasoft app.telemetry agents (that you should have already installed in your infrastructure) by means of opening the “Agents” root group in the tree on the left side and adding agent groups and new agents with the “New” actions from context menu.
Note: Do not create two agent objects for the same physical server. The second app.telemetry agent opening a connection to the same agent will be marked as disconnected, because another agent is already connected.
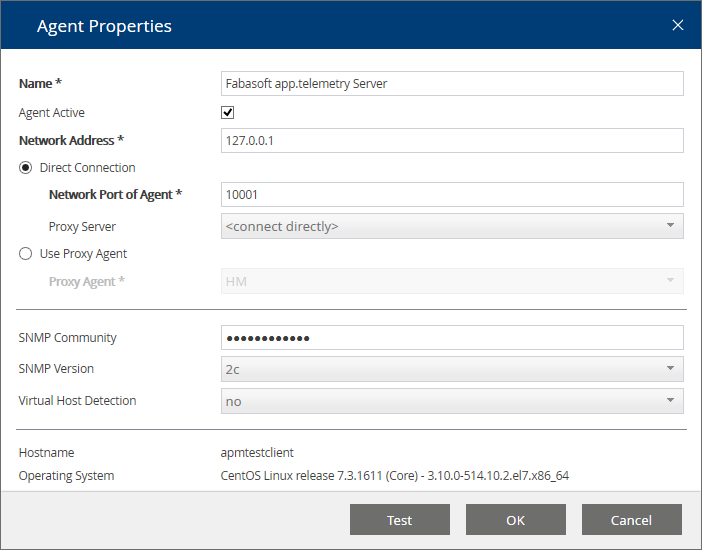
Set up SNMP Community for the Agent
Fabasoft app.telemetry agents that need to query counters using the net-snmp protocol use the specified “SNMP community” to connect to the SNMP daemon. If the SNMP community is not set, the default community “public” will be used. If the SNMP community is not set correctly for your SNMP system, timeouts may degrade the performance of the Fabasoft app.telemetry agent.
Using Fabasoft app.telemetry Proxy Agent
Some situations require monitoring remote systems that do not have a Fabasoft app.telemetry agent installed. For such situations another Fabasoft app.telemetry agent can be used as proxy agent to perform remote calls using the net-snmp protocol.
In order to use this feature enter the remote network address of the target system that should be monitored and select another agent as “Proxy agent” from the combo box. Then enter the “SNMP community” to be used for the remote SNMP queries.
“Virtual host detection”: … to detect on which server a virtual machine (VM) is running
In order to use the “virtual host detection” feature you have to configure a proxy agent for the virtual host server (VMware ESX Server, Microsoft Hyper-V) that is able to query the required fields (SNMP counters) from that server defining the remote IP address of that virtual host server.
Note: If you turn on the virtual host detection, be sure that the SNMP service on the target virtual host server (VMware ESX) is turned on and configured correctly, otherwise timeouts may degrade the performance of the Fabasoft app.telemetry agent.
Detection of Applications
Applications that are instrumented with the Fabasoft app.telemetry SDK and run on any system in your infrastructure where also an installed and configured app.telemetry agent is running will register themselves on the Fabasoft app.telemetry server and appear in the internal service group „New Services” in the infrastructure.
These service groups and services can be moved to the desired point in the infrastructure by means of cut and paste (via context menu actions in edit view).
Creating Service Checks
Every service should have at least one defined service check which is responsible for the status of this service. Otherwise, the state will stay at the value “OK”.
For creating a new service check you have to select the service for which the check should be connected and use the “New Service Check” context menu action. A new dialog for selecting the desired service check type will be displayed.
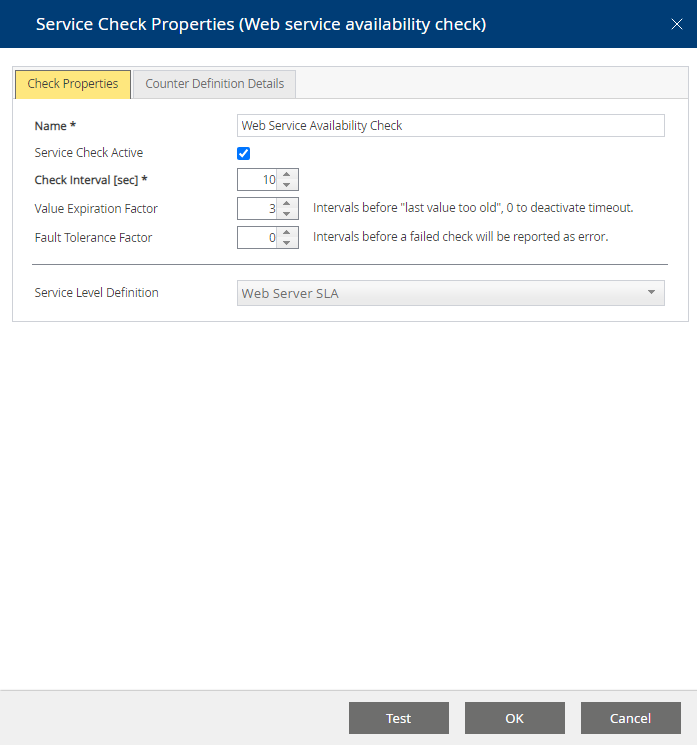
After selecting the service check type a type-specific dialog for defining the check properties will be opened.
Enter the counter definition details (specific for that type) and switch to the check properties tab to finish the definition of that service check.
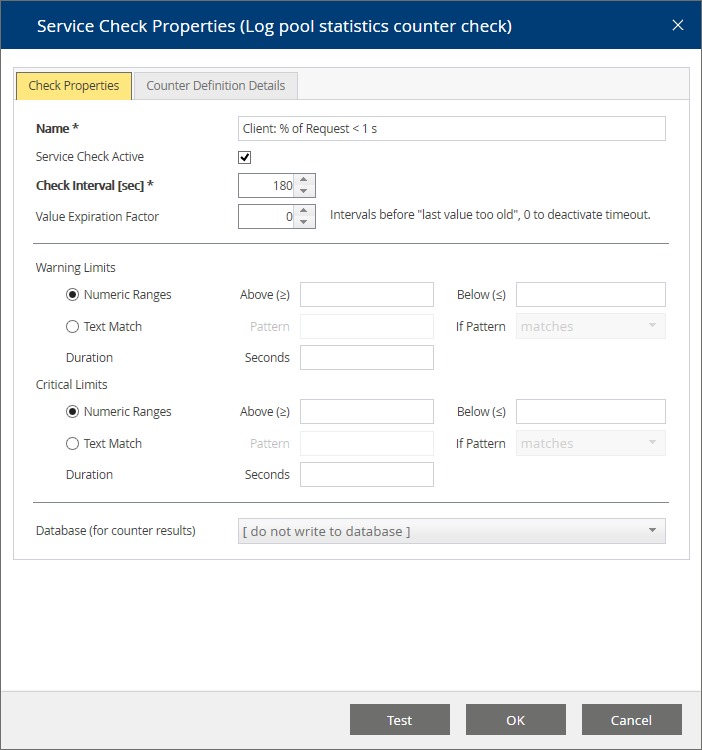
Optionally service checks for counter types can also be defined with limits for warning and critical state.
Syntax for Counter Limits
If the limit field is kept empty, the result state of this counter will always be OK returning the counter value.
If warning and critical limits are defined the service check state will change to that state if the defined limits match – that is if an “above” limit is set and the current value exceeds that limit.
Examples:
- Critical Limit: Below: 200 … if the value is 170 then the resulting state is critical
- Warning Limit: Above: 150 … if the value is 170 then the resulting state is warning
- Warning Limits: Above: 50 and Below: 180
+ Critical Limit: Above: 200 … if the value is 170 then the resulting state is warning (but not critical)
Using a Limit Duration
If you don’t want to get notified of each counter check value exceeding the limit, but only for those that stay longer than a given time period out of the defined limit, you have to define a duration value in seconds.
Duration is the value in seconds after which the state changes (if value exceeds the limit all this time)
Example for “% Processor CPU Usage”
- Warning Limit: Above: 80 with Duration[sec]: 15 ... warn if value is higher than 80 for more than 15 seconds. (Requires a check interval smaller than 15 sec)
Fault Tolerance Factor
Availability checks will report errors and warnings as soon as the status change is detected. In case you have a service that is allowed to be unavailable for a short while, you may specify a “Fault Tolerance Factor” to allow n intervals to return error before reporting the check as error. The latest check result will be reported in the status description, but the status itself will not change if there is at least one check reporting ok within the last n+1 intervals.
Special Service Checks and their Parameters
Counter Checks Using Existing Counter Definitions
Using a preexisting counter definition for a new service check is the easiest way to create one. Only select the counter from the list.
The counter definitions can be modified and extended via the root group “Counter Definitions”.
Counter Checks Using Formula
Define a formula with references to protocol-specific counters in the following format: {<protocol>:<targetvalue>}
For example:
- {snmp:.1.3.6.1.2.1.2.2.1.16.2}
- {winperf:\System\Threads}
Mathematical expressions with brackets () and operators (+,-,*,/) can be used.
The following mathematical functions are also available for converting values:
- delta() … calculates the difference between the last two values of a counter
- delta32() … calculates the difference between the last two values of a counter and permits counter overflow on 32-bit raw-data
- delta64() … calculates the difference between the last two values of a counter and permits counter overflow on 64-bit raw-data
- deltaPerSecond() … calculates the average per second over the last check interval
- delta32PerSecond() … calculates the average per second over the last check interval and permits counter overflow on 32-bit raw-data
- delta64PerSecond() … calculates the average per second over the last check interval and permits counter overflow on 64-bit raw-data
Linux /proc Counter Checks
Select the processor or the process and the desired counter to monitor.
These values are fetched from the Linux /proc file system.
Linux Process Availability Checks
Select a desired Linux process from the list of currently running processes (on the remote Fabasoft app.telemetry agent).
It is monitored if this process is running.
SNMP Counter Checks
Dynamic indexes
Select an SNMP table, instance and counter from the lists to monitor.
The list contents are fetched from the remote Fabasoft app.telemetry agent.
Since 2013 Winter Release SNMP counters obtained from an SNMP table instance are stored in the app.telemetry infrastructure with a special syntax to keep the selected named instance also after possible table index changes: <FULL-OID>[“<named instance>”,<table-depth of index column>, <OID of table-name column>]
Example for SNMP Counter: IF-MIB::ifTable > IF-MIB::ifInOctets > eth0
- FULL-OID (of desired counter): .1.3.6.1.2.1.2.2.1.10.2
- Named instance: "eth0"
- Table-depth/length of index column: 1
- OID of table-name column: .1.3.6.1.2.1.2.2.1.2
- … this results in the following special counter definition: .1.3.6.1.2.1.2.2.1.10.2["eth0",1,.1.3.6.1.2.1.2.2.1.2]
Note: You can use these special OIDs also in counter checks using formulas or counter definitions to be independent from table index changes in SNMP tables. In order to get this special OID for your desired SNMP counter, just create a new SNMP counter, select the table, instance and counter from the list boxes – save the counter check – open it again by means of using the “edit” button and look up the SNMP OID field.
Timestamp formatting
To format an integer value as a time duration or datetime value, add one of the following options to the OID:
- “seconds”: the value in seconds will be formatted like [ddd] hh:mm:ss
- “timeticks”: the value in milleseconds will be formatted like [ddd] hh:mm:ss.ms
- “epoch”: the value in seconds since epoch will be formatted like yyyy-mm-dd hh:mm:ss
e.g: OID = “.1.3.6.1.2.1.25.1.1.0,timestamp”
Parsing of hex strings
To convert a hex string into an integer value, add the option “hexstring” to the OID
Web Service Availability Checks
To define an HTTP check fill in all required fields of the counter definition details tab:
- Target URL: http://.../
- Authentication settings:
- Anonymous Authentication
- Kerberos/Integrated Authentication
- On Microsoft Windows the service account is used for authentication (requires the agent service to be run under a domain account).
Note: When changing the service account of the agent service, ensure that this account has enough permissions for other checks (e.g. for Windows Performance Counters – be member of “Performance Monitor Users” group) and to access all working directories used by the agent service (e.g. file counter checks).
- On Microsoft Windows the service account is used for authentication (requires the agent service to be run under a domain account).
- Basic Authentication: with user name and password
- Certificate (for Linux-based app.telemetry agents):
- Define the certificate filename (client1.pem)
- Certificate has to be deployed manually to the target agent into directory: /etc/app.telemetry/
- The p12-certificate has to be converted into pem-Format:
Certificate conversion: openssl pkcs12 –in user.p12 –clcerts –out user.pem
- Certificate (for Windows-based app.telemetry agents)
- Define the certificate CN name (clientcert)
- The certificate to be used has to be installed in the personal certificate store of the service user account of the Fabasoft app.telemetry agent. So if you want to define a HTTP Check using certificates, you have to change the service account of the agent service to a user account (the local system account has no personal certificate store associated) and import the certificate into the personal certificate store of that user.
Note: Be careful when changing the service account of the agent service – for details see previous note. - To select a certificate out of multiple installed certificates, specify the CN of the certificate in the certificate parameter. Apart from that situation the certificate parameter is optional.
- Optional using an HTTP-Proxy
- Display Result Value: you can display different result values in the service check message column
- Check Retry Count: default = 3 … this is the HTTP-retry count performed if the check fails (without any delay)
- Check Server Certificate: When checked, a SSL certificate will be validated and the check will fail if the certificate is not valid. Due to a bug in the underlying libcurl library each request may leak memory on the agent process performing web service checks with this option activated (LINUX only).
Microsoft Windows Performance Counter Checks
Select a Microsoft Windows performance counter from the dynamically filled lists for object, instance and counter.
Microsoft Windows Service Availability Checks
Select the desired Microsoft Windows process from the list of currently running processes (on the remote Fabasoft app.telemetry agent).
It is monitored if this service is in running state.
Microsoft Windows Cluster Resource Availability Checks
If the Fabasoft app.telemetry agent is running on a Microsoft Windows cluster node you can select one of the dynamically filled Microsoft Windows cluster resources to monitor.
Red Hat Cluster Suite Service Availability Checks
If the Fabasoft app.telemetry agent is running on a Red Hat cluster node you can select one of the dynamically filled Red Hat cluster suite services to monitor.
Log Pool Statistics Counter Check
Select a specific log pool in order to get information about the performance of the requests inside the log pool.
You can limit the time range of requests regarded for this check calculation (in minutes) or use all available data from online log pool (in memory).
Decide whether to calculate the average request duration or the percentage of requests faster than <x> seconds.
Since Fabasoft app.telemetry 2012 Summer Release you can exclude requests from this calculation with a filter defining the maximum request duration (in seconds). All requests that last longer as this defined limit will not be regarded for this check calculation.
Since Fabasoft app.telemetry 2014 Fall Release a message “No Requests” is being displayed instead of no value when no requests have been processed for the given interval.
With Fabasoft app.telemetry 2016 a new statistics is available calculating the percentage of users that have a sufficient rate of requests without errors. To calculate the measure you have to provide the name of the request log column identifying a user and the percentage of requests to be error free to count a user as being able to work. The “Maximum request duration limit” is not respected during calculation. To avoid sporadic errors during low usage times, a minimum count of active users can be specified. If less users were active, no value is generated.
Since Fabasoft app.telemetry 2017 UR1 you can specify a minimum request count that is required to generate a value. With this setting you can avoid unrepresentative values in situations with low work load.
TCP Ping Availability Checks
Enter the target host (IP address or resolvable DNS hostname) and target port (TCP port number) you want to check. Additionally you can choose whether to display only the state or also the duration (in milliseconds) the check did use. Optionally you can define data to be sent with the TCP package.
ICMP Ping Availability Checks
Enter the target host (IP address or resolvable DNS hostname) you want to check and optionally specify a timeout (in seconds). Additionally you can choose whether to display only the state or also the duration (in milliseconds) the check did use.
Counter Check Using File System
In some situations counter values are much more complex to obtain or may be the result of other program executions. Therefor app.telemetry provides the “counter check using file system” to check and read a value from a text file on the local file system of the app.telemetry agent host.
All text files readable by the app.telemetry agent user located in the following directory are regarded as possible file counter check results and can be selected from a list box while creating or editing a service check of type “counter check using file system”:
- Microsoft Windows (Agent platform): C:\ProgramData\Fabasoft app.telemetry\status
- Linux (Agent platform): /var/opt/app.telemetry/status
The first value in the first line of the status file will be used as counter check result value. Only numeric integer values are supported as result values. Decimal fraction parts will be cut off. Invalid value formats as well as textual values will be interpreted as simple text and cannot be validated with counter limits.
Since Version 2017 Update Rollup 1 a UTF-8 BOM is skipped.
The validity of counter check results based on the change timestamp of the status file can be defined with the following two service check properties:
- Check Interval [sec]: the interval the value is updated from the status file (should be approximately the same as the status file is updated or at least twice often)
- Value Expiration Factor: the number of check intervals the result value is regarded as valid <check interval> x <value expiration factor> = <number of seconds> of max-age of status file (if the status file timestamp is older than that amount of time it is regarded as invalid and the counter check status is changed to warning “last value too old”. This mechanism helps detecting problems with the update-script that generates and updates the status file.
Using Software-Telemetry Log Pools and Top X Reports
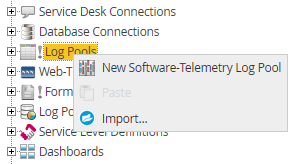
Create a new “Log Definition” in the edit view by means of using the context menu on the “Log Pools” root group.
Enter all required fields and define the desired log definition for your application.
Set a name for the definition and define for which applications (Application Filters) the logs should be collected.
Note: The application filter definition for different log definitions should not overlap, because the first log definition will get the events that match the filter and the others will not.
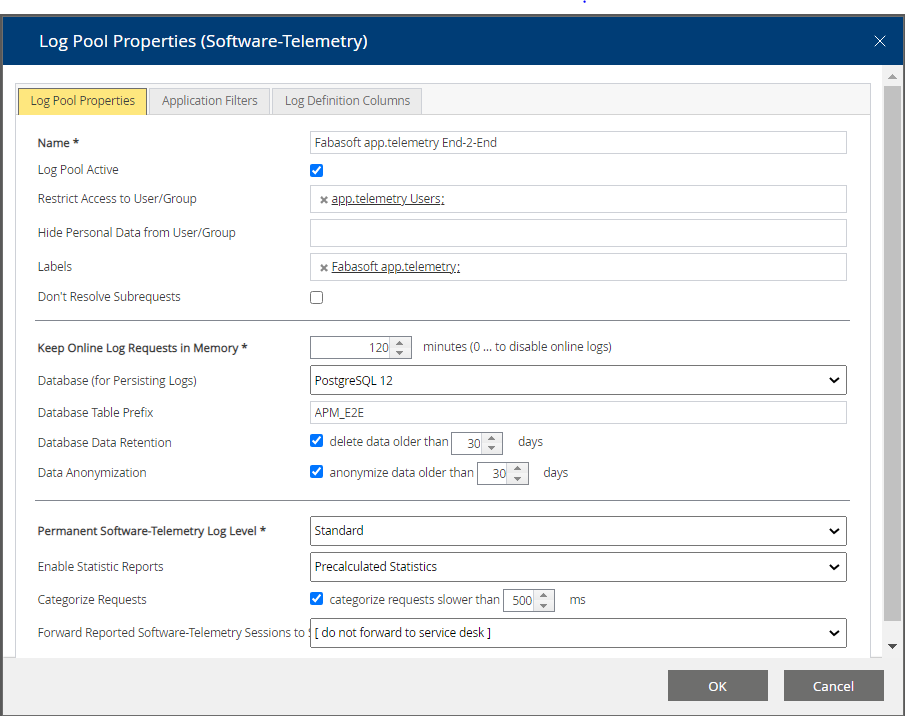
List users and groups which may have access to the log pool in “Restrict Access to User/Group”. Users and groups which have access, but are not able to see anonymized columns (as given in the log definition) are specified in “Hide Personal Data from User/Group”.
To turn off resolving of subrequests, check “Don’t Resolve Subrequests”. Requests are then resolved only down to the level of this log pool.
The number of requests held in memory is set by the number control above (it is defined in minutes with a maximum of 120 minutes = 2 hours). If you want to view the requests for a longer period in the online log view, you need to define a database for persisting the logs.
Specify the database where you want to store the Software-Telemetry logs. If the database persistence of the telemetry requests is not required specify “[do not write to database]”.
Check “Data Anonymization” to activate anonymization. The columns marked in the log definition with the corresponding “anonymous” flag are then written to the database in anonymized form, but you are still able to see the real values as long as the data is not older than the specified number of days.
Select the desired recording level for permanent Software-Telemetry data collection (outside of manually started sessions).
To turn on Top X reports for that log pool you need to set the property “Enable Statistic Reports” to either “Precalculated Statistics” or “On Demand Statistics” and you also need to have a log definition with statistical flags (measures, dimensions) defined.
“Precalculated statistics” are calculated for 10-minute intervals all the time and are stored in separate database tables so Top X reports on a big amount of telemetry data are much faster, but this type of statistics will also use more memory and disk space!
“On Demand Statistics” will be calculated only when required for the requested time range directly on the database. A database must be defined in order to use “On Demand Statistics”!
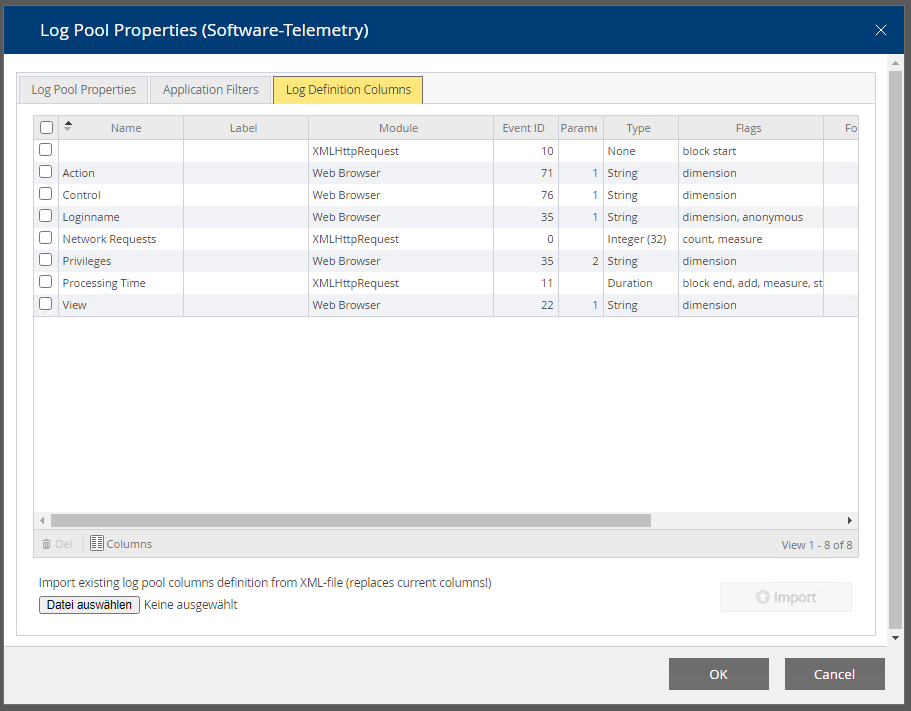
Specify the log pool columns structure of your application by means of switching to the second tab (“Log Definition Columns”) selecting the log definition XML file from the file system and finally pressing the “Import”-button. This application log columns definition file (XML) is distributed by the application vendor of the instrumented application.
Note: Reported feedback sessions (reported with the Report-SDK function from inside any application) will only be processed if there exists any log pool for that application that invoked the report function (by means of a matching application filter) or at least a default log pool without any application filter restrictions. Such reported sessions can be automatically forwarded to a defined service desk (if defined with the drop-down box) – each reported session will be forwarded to that service desk (if defined).
Top X Report / Drill-Down Analysis
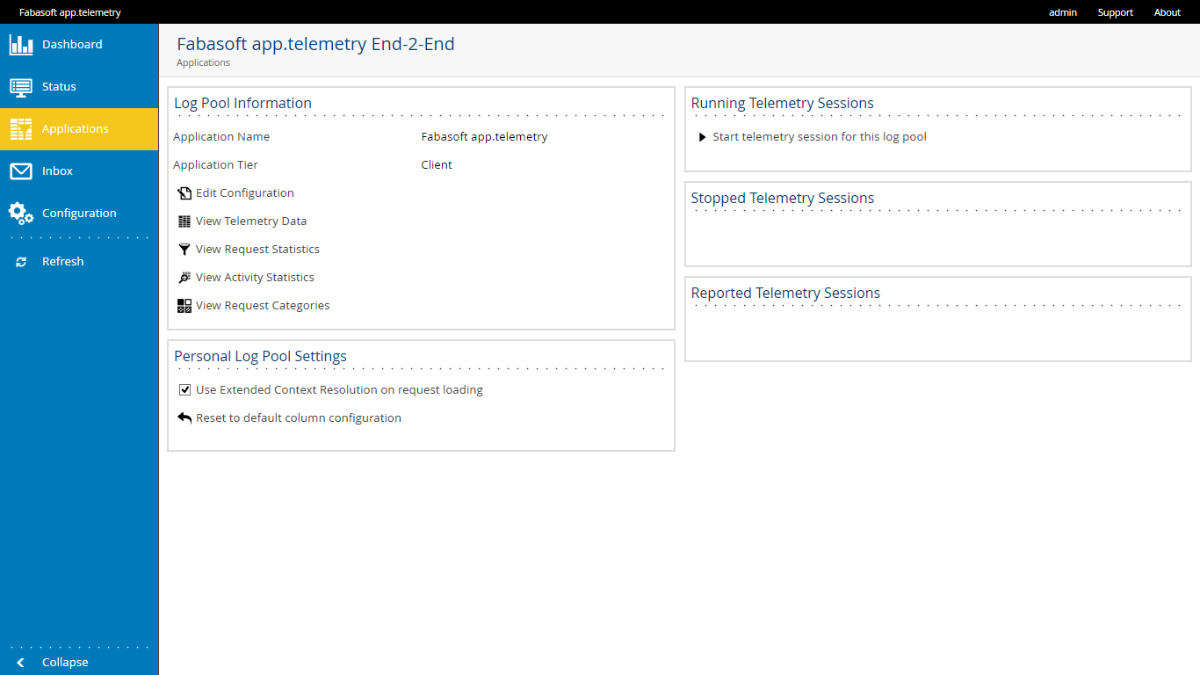
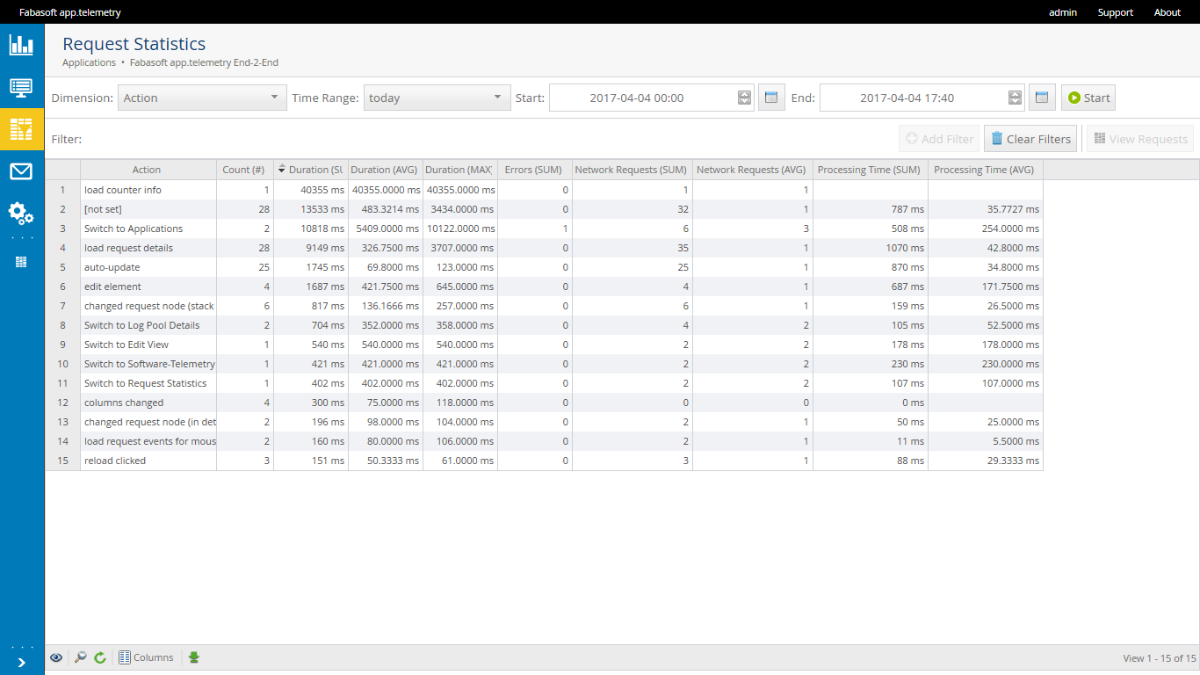
After you have configured a Software-Telemetry log pool with a valid log definition (application log columns including dimension and measures flags) and the “Enable Statistic Reports” flag is turned on the Top X report view can be used to analyze the performance and bottlenecks of your instrumented application.
Switch to the Application view, select the desired log pool and “View Request Statistics”.
On the report view you have to select any dimension you are interested in and the report time range and start the calculation (which may require some time to be calculated depending on the data amount and time range).
The resulting report will contain all requests of that time range grouped for same values of the selected dimension.
For a drill-down analysis you can select one row and add this dimension as filter value (by means of using the context menu action “Add Filter”). Afterwards change the selected dimension to another interesting dimension and recalculate the report via the “START” button. To view the request of a selected report row double-click the row to switch to the telemetry view applying all filters according to the selected row.
Configure a Database for Software-Telemetry Logs
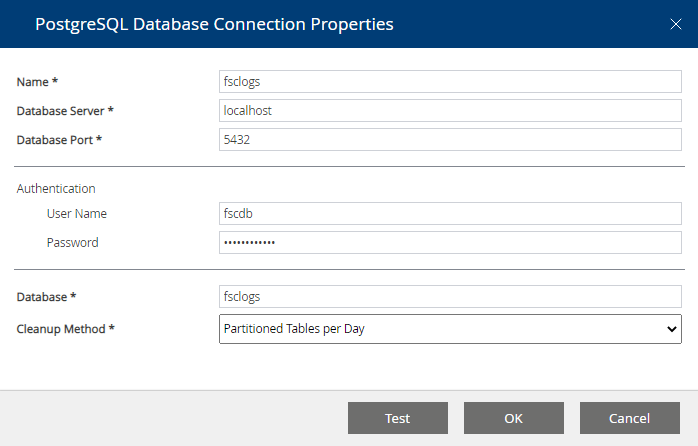
On Linux systems specify the credentials and connection parameters for the PostgreSQL database. The PostgreSQL database must be set to a valid authentication mode – either set to local trusted access (“trust”) or to password based authentication (“password”).
On Microsoft Windows systems choose integrated or basic authentication, but basic authentication is not enabled on Microsoft SQL Server by default.
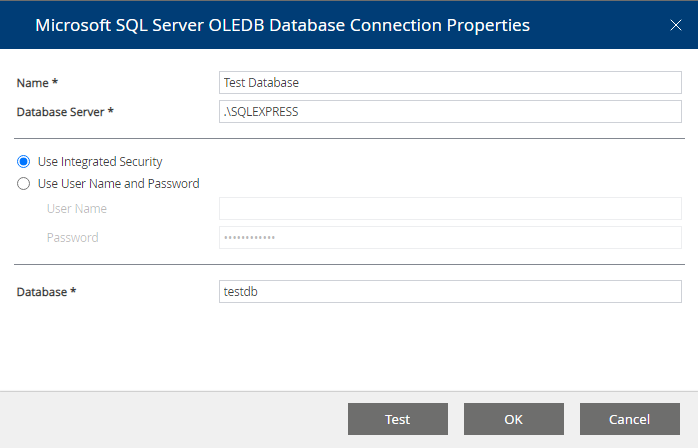
Define the database connection in the following format:
<servername>\<SQL-Server-Instance>
For example: “.\SQLEXPRESS”: for local Microsoft SQL Server Express Edition.
Since version 2013 Summer Release the app.telemetry Server also supports the PostgreSQL database on Microsoft Windows (to be able to use a free and unlimited database). For details on how to install, configure and use PostgreSQL for Microsoft Windows see appendix chapter “Using PostgreSQL Database for app.telemetry Server on Microsoft Windows”.
Filtered Log Pools
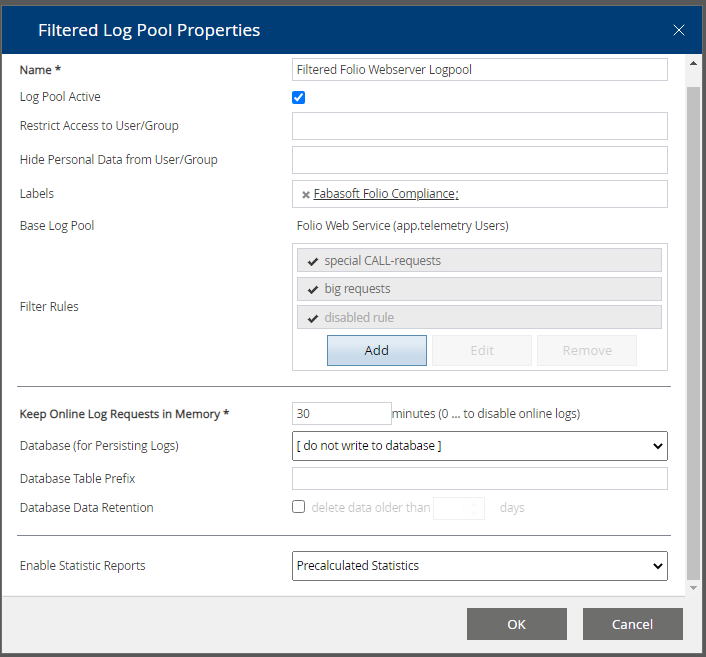
With Version 2014 Winter Release the filter rules for “Filtered Log Pools” have been reworked for easier editing and to support more complex filter expressions. With filtered log pools you can monitor and work on a specific subset of requests. A filtered log pool is based on a normal Software-Telemetry log pool and defines additional filter criteria. Filtered log pools store their subset of filtered requests in a separate database table therefore statistical analysis of filtered log pools also work as expected on that subset of data.
You can create a new “Filtered Log Pool” from inside the edit view by creating a new object below an existing base log pool or directly from the telemetry view by saving an existing filter set to a new or to an existing filtered log pool.
Filter Definition:
The filter rules consist of a list of filter expressions which can be added or modified with a special sub dialog providing input hints and a list of properties (active, accept/deny, negate, comment). Any existing old filter expressions will be transformed into the new format and shown as “default” rule.
All incoming requests are checked against the filter rule chain from the top to the bottom. The first matching “accept”-rule will accept the request and stop checking any further rules in the chain. Note: You need at least one “accept”-rule at the bottom of the chain otherwise the incoming requests will not be accepted. Requests that are accepted by the filter rule chain are copied into the filtered log pool. The filter expressions can contain any column of the base log pool columns.
For easier filter definition you can try the effect of filters on the base log pool in the telemetry view and copy them over to the desired filtered log pool by means of using a sub-menu action of the “Save to …” button. The filters are full-featured custom filters that can be modified and combined on demand.
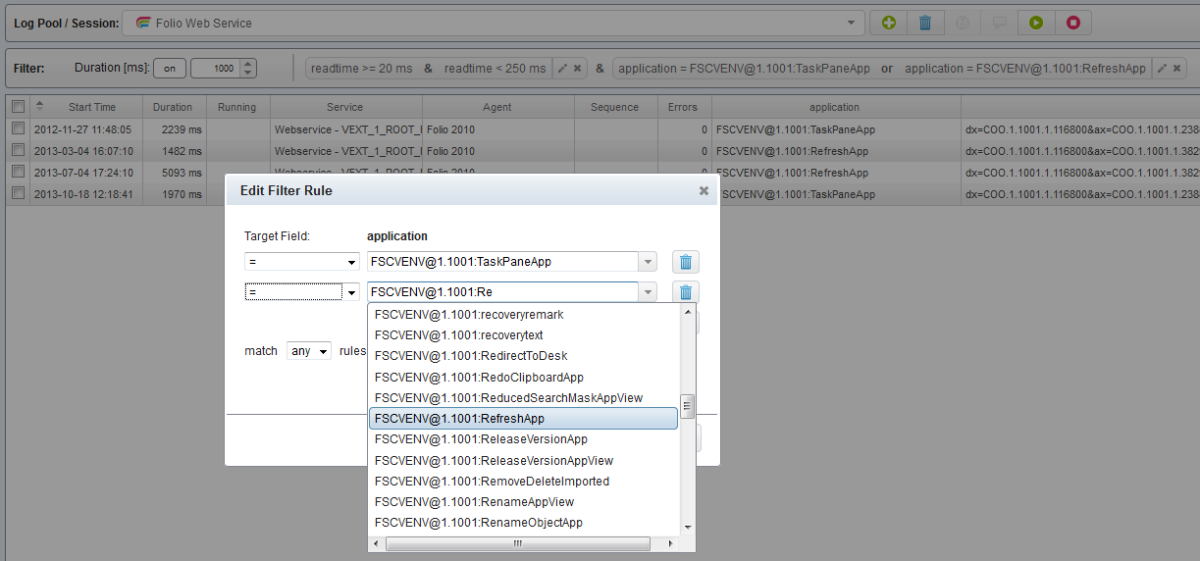
The filter rules for several different columns are connected with the AND-operator (&) which means every filter-rule must be fulfilled. A single filter rule can either be a simple expression or can also be formed as complex rule with more than one expression. Those sub-expressions are by default connected with the OR-operator (match any rule) but can also be configured as AND-connected term (match all rules).
![]()
Filters can be added by selecting a single row (on report view) or a single table cell (on telemetry view) and pressing the “Add Filter” button or context menu entry. This action immediately adds the filter to the filter bar with a default comparison operator (normally “=”). When adding a second filter value for the same column the existing filter rule for that column will be extended with a second OR-connected term.
In order to modify or extend an existing filter rule, just hit the edit button in the right actions area of the filter rule bar and an “Edit Filter Expression” dialog will be opened. This filter dialog is limited to the filter column the filter was defined for but can contain one or more filter expressions with different comparison operators and different values. Based on the column data type different operators and value hints are supported.
Special Data Type Handling:
- Text values (e.g. Loginname): support equals comparison, some kind of contains operators, regular expressions and auto-complete
- Numeric values (e.g. sendbytes): support numeric comparison (=, >, <, …)
- Duration values (e.g. readtime): are formatted in milliseconds (ms) and support nearly the same numeric operators as numeric values (except equals comparison because of the inaccuracy of the high resolution time values)
- Date/Time values: are formatted as human readable date/time entries and are presented in a date/time-input control for easier date/time input. This type supports ordered comparison (=, >, <, …)
- Fabasoft Object values (e.g. dstappview): are using internal COO-address formatting rules as well as name-resolution via fscdata.xml. The display value of the filter is the object name if available. The auto-complete input will allow you to find the appropriate Fabasoft object with a prefix-match. Because of the complex internal handling only equal-comparison is possible for that type.
View on Log Pools
With Version 2014 Summer Release a new extended type of log pool – the “View on Log Pool” was introduced. This new view log pool serves as the name implies as logical view on the base log pool with some special conditions.
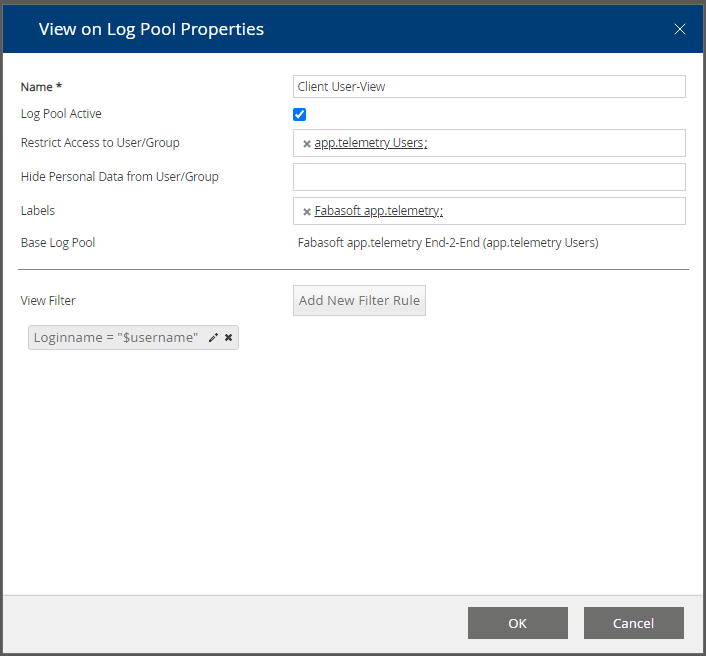
A view log pool can be created on any other log pool by means of selecting the desired base log pool and creating a new “View on Log Pool” using the context specific menu button. You can specify a view filter expression based on any dimension column defining the condition which requests are shown in the view. Additionally to normal literal filter expressions a special dynamic value placeholder “$username” can be used to limit a view on only those requests produced by the user itself.
Example: In order to allow your developer team members access to telemetry requests or feedbacks of their own the administrator has to create a new view on the base log pool, limit the access to an access group containing the developer accounts and create a view filter restricting the login name column the dynamic $username filter value.
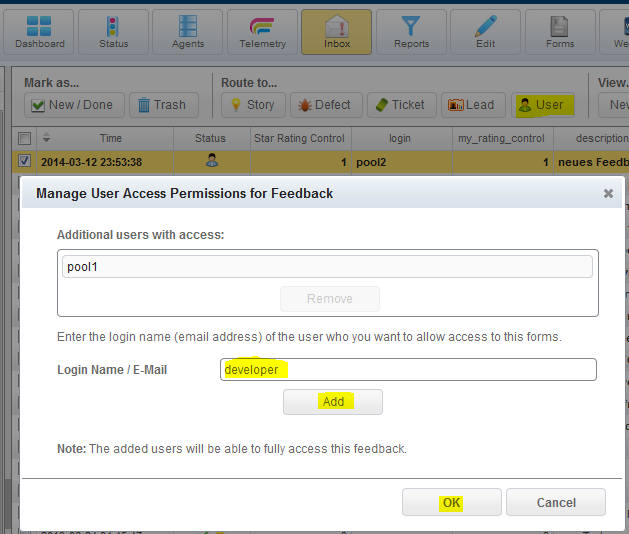
Additionally a privileged user can delegate any feedback (he has access to) to another user (support team, developer, …). Just select a desired feedback on the Inbox view, click the “Route to … User” toolbar button and add the desired login name of the target user who you want to give access to. This dialog can also be used to remove access delegation rights again.
Syslog Log Pools
Syslog log pools are a way to handle a big amount of syslog entries in a well-defined and structured way using the power of Software-Telemetry log pools in combination with powerful filter rules within filtered log pools.
In order to use Syslog log pools you have to install an app.telemetry syslog forwarder module on every target system you want to capture syslog entries from. For more details on prerequisites and installation instructions see the appropriate chapters above.
Once this apptelemetrysyslogforwarder daemon is configured and started you have to configure a new Software-Telemetry log pool (app.telemetry client - edit view) and set up the filters to “Fabasoft app.telemetry” as application name and “Syslog Forwarder” as application tier name. With the “Permanent Software-Telemetry Log Level” field you can configure the amount/severity of log entries to be captured (e.g.: with level “Detail” you will also get “Informational” log entries but not those of “Debug” severity).
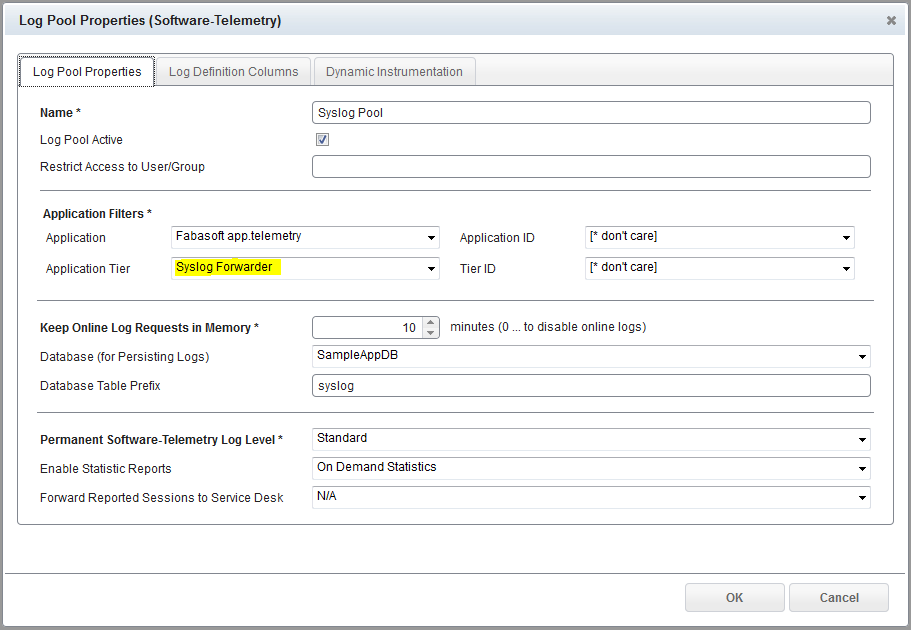
In order to reduce the memory usage for that log pool you should set up a database for persisting the syslog entries and set the limit for in-memory requests to a very low value as well as the setting for the statistics calculation to “On Demand Statistics”. A predefined log definition for that log pool is also available within the KIT (…\Telemetry-Modules\LogDefinitions\syslogforwarder-logdefinition.xml) that should be imported via the Log Definition Columns tab.
After you have set up your syslog log pool you can watch incoming syslog entries as telemetry requests in the created log pool and you also can analyze the entries via the report view.
In order to reduce the set of log entries you can create a filtered sub log pool with a defined set of filter rules (supporting complex expressions as well as regular expressions).
Microsoft Windows Eventlog Forwarder
Just like the syslog forwarder on Linux, Fabasoft app.telemetry provides a Microsoft Windows service to read Eventlog entries. In order to install this service start the eventlogforwarder-setup.exe from the app.telemetry\Telemetry-Modules\WINDOWS_X64 folder of the Fabasoft app.telemetry installation package.
In order to configure a log pool receiving the eventlog data, create a new Software-Telemetry Log Pool, select “Fabasoft app.telemetry” as the Application and “Eventlog Forwarder” as the Application Tier. Choose a Permanent Software-Telemetry Log Level to filter event logs based on the event level. Import the eventogforwarder_logdefinition.xml from the LogDefinitions folder into the Log Definition Columns will provide the common properties of the events in the request view. Create Filtered Log Pools or View Log Pools to filter eventlog entries as needed.
By default the Fabasoft app.telemetry Eventlog Forwarder will read events from the System and the Application source. In order to read event from other sources use the Registry Editor to add an additional key under HKLM\SOFTWARE\Fabasoft app.telemetry\Eventlog Forwarder and add a String Value named path holding the Name of the event log source.
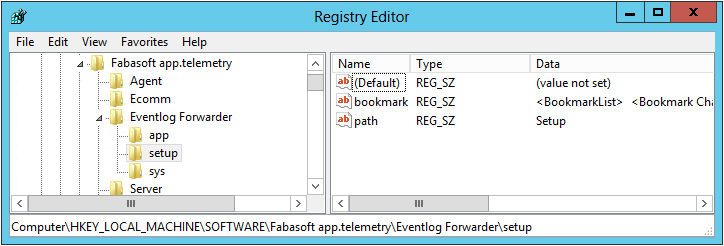
The bookmark property is used by the eventlog forwarder to store the bookmark to the last entry which has been forwarded so that it knows where to continue reading data even if the service is restartet. You may force the retransmission of all entries by deleting the bookmark and restarting the eventlog forwarder service.
Inbox for Incoming Feedbacks
With version 2013 Fall Release a new view called “Inbox” was introduced showing any incoming feedbacks (also known as reported sessions sent by an instrumented application via the reporting API calls) as structured list with a quick preview of containing meta data (including a screenshot if available). The feedbacks will still be listed in the application log pool detail page.
The feedbacks are grouped by the instrumented application which sent the feedback. If there does not already exist a form log pool for an incoming feedback a new auto-generated form log pool will be created which cannot be designed via the forms designer.
Note: A Software-Telemetry log pool for the instrumented application (which sends the feedback) must exist in order to get feedbacks from the application.
Feedback Forms Designer
Since version 2013 Fall Release a graphical forms designer was added to the on-premise version which helps you to design full-featured feedback forms by means of drag&drop fields into a form and customize the text, colors and styles.
In order to use these new feedback forms you have to follow the steps below:
- Design a new form
- Navigate to the “Edit” view inside the app.telemetry client
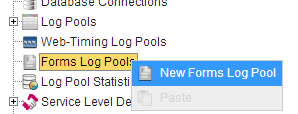
- Select the infrastructure group “Forms Log Pools” and click the menu action “New Forms Log Pool” (or “Design” if you already have an existing designed form).
- Design your form
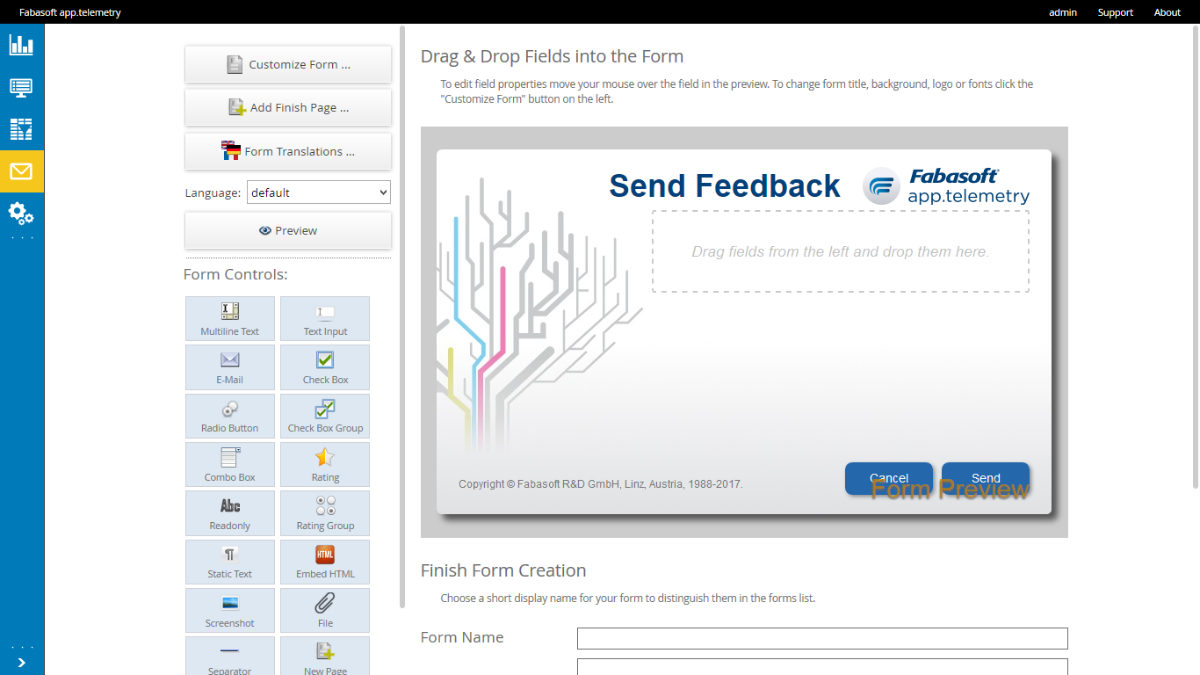
- Configure the base settings of your form (title, styling, fonts, colors, logo, background, …) by means of using the “Customize Form” button.
- Add input fields to your form by means of dragging some of the available form controls from the left side to the form preview.
- Enter a name and optionally a description and save the form with the “OK” button at the bottom.
- Software Update:
- Update all app.telemetry software (Server, Agent, WebAPI) in your infrastructure to 2013 Fall Release or later.
- Update the JavaScript SDK (softwaretelemetry.js) used by your instrumented application (e.g. Folio web client) to the latest version shipped with the app.telemetry software package (can be found in the folder “Developer\JavaScript”). This update (to 2013 Fall Release or later) enables the SDK to load the feedback dialog resources from the WebAPI.
- Enable the new feedback form (Form Log Pool) as report dialog for your instrumented application:
- Either by assigning the “Forms Log Pool” as default form for a “Software-Telemetry Log Pool” (of an instrumented application) by means of using the “Set as default Form” menu action.
Note: This assignment of a default form for a log pool will replace any standard SDK dialog with the new designed form. - Or by manually adding the new “Form ID” (which can be found in the forms designer after editing the created form in the form properties at the bottom of the page) to the ReportDialog API-call (in your instrumented application) as last parameter: apm.ReportDialog(null, _filter, _reportkey, _description, _parentNode, _metadata, _formOptions);
Example: apm.ReportDialog(null, _filter, _reportkey, null, null, null, {formid: “FORM12345”, language: “de”});
- Either by assigning the “Forms Log Pool” as default form for a “Software-Telemetry Log Pool” (of an instrumented application) by means of using the “Set as default Form” menu action.
- Test sending new feedbacks from your instrumented application and watch the app.telemetry “Inbox” view for new incoming feedbacks.
- In order to receive feedback notifications via e-mail you have to configure a default notification channel in the “Server Properties” dialog at the “Feedback Configuration” tab.
Configure Web Timing
For detailed end-user experience monitoring including page loading times from your web browser client you have to include a JavaScript block into the web page you want to monitor and you have to create a “Web Timing” log pool in your app.telemetry infrastructure.
In order to enable the “Browser Telemetry” for your web page you have to put the browser-telemetry script somewhere reachable for your web server and then include the following script block in your web page HTML code (the best choice is to put the code in a HTML header template for all of your web pages).
JavaScript Snippet to Include for Web Timing |
|---|
<script type="text/javascript">/*<![CDATA[*/ __apmcfg={ id:"APM12345", /* replace with your desired application id */ ts:new Date(), url:"//yourdomain.com/", /* replace URL with your app.telemetry WebAPI server */ apptype:"html" }; (function(d, t, c) {var s, scr, id = '__apm_script'; if (!d.getElementById(id)) {s = d.createElement(t); s.async = true; s.src = ('https:' === d.location.protocol ? c.url.replace(/^(http:)?\/\//, 'https://') : c.url) + (c.lb || 'v1') + '/web.telemetry?RESOURCE&file=apm.js'; s.id = id;scr = d.getElementsByTagName(t)[0]; scr.parentNode.insertBefore(s, scr); }}(document, 'script', __apmcfg)); /*]]>*/</script> |
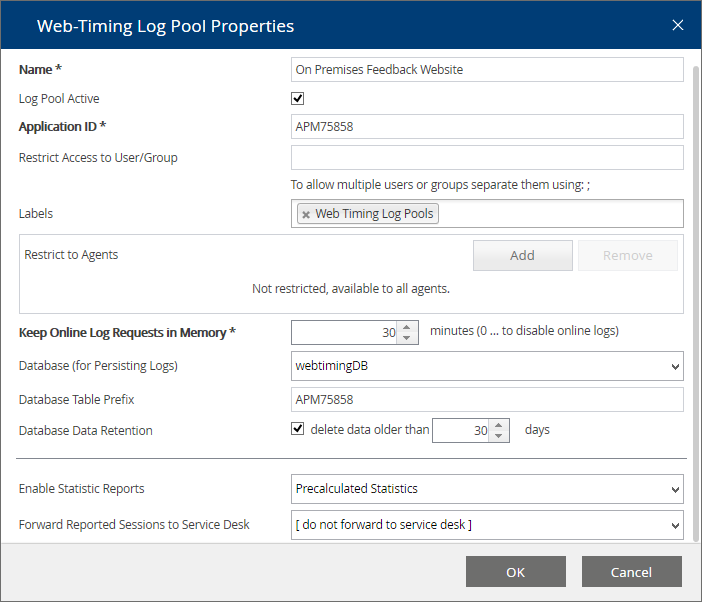
The last step is to create a new “Web Timing Log Pool” in your app.telemetry infrastructure from within the edit view and filling in your chosen application id.
Configure Web Timing with Feedback Dialog
Fabasoft app.telemetry also supports the integration of an end-user feedback dialog into your web application. The feedback dialog transmits the text message the user entered with additional metadata and the request information about the last clicks of the user with a reported session to the Fabasoft app.telemetry server (via app.telemetry WebAPI).
Since Fabasoft app.telemetry Version 2015 all required resources are loaded from the target WebAPI.
To include the feedback button in your page just include the following HTML snippet somewhere in your HTML page (template):
HTML Snippet to Include for Feedback Button |
|---|
<button class="apm-feedback-button apm-feedback-button-fixed apm-feedback-button-top apm-feedback-button-right"> <span class="apm-feedback-icon apm-ic-logo20"></span> <span class="apm-feedback-button-text">Feedback</span> </button> |
Configure a Notification Channel
Fabasoft app.telemetry supports sending notifications by email or by executing a command line.
SMTP Notification Channel (Linux)
If you run the Fabasoft app.telemetry server on Linux, the e-mails are sent via the local sendmail (which is usually provided by the postfix package) process on the Linux server, so you have to setup your sendmail provider to forward the e-mails to your desired SMTP server. It is not possible to configure the remote SMTP server on a Fabasoft app.telemetry Linux server via the Fabasoft app.telemetry client interface.
Note: If sendmail is provided by postfix (which is highly recommended) to postfix service must be enabled, started and may need additional configuration for mail delivery to work.
SMTP Notification Channel (Windows)
The standard SNMP Notification Channel under Microsoft Windows is implemented using CDO. StartTLS is not supported by CDO and will not work.
Create a “SMTP Notification Channel” defining the mail server used to send notifications to the desired notification accounts.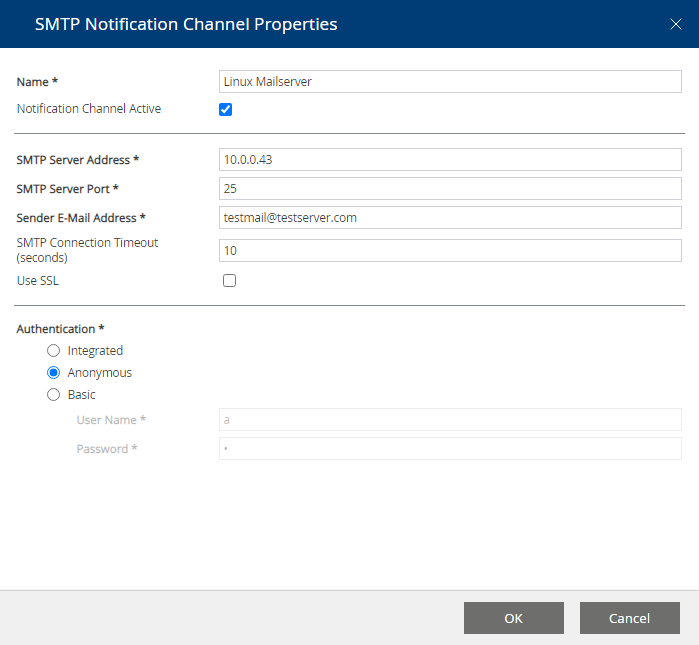
SMTP Notification Channel (cURL)
Since Fabasoft app.telemetry Version 2020 (for Linux) and 2023 (for Microsoft Windows) mails can be sent by the curl library. CURL can send mails directly to SMTP Servers. Selecting SSL will require StartTLS on the Server.
Command Line Notification
Configure a Command Line Notification to execute a specified command on the app.telemetry server when a notification is triggered.
Configure Notification Account
- Configure target “Notification Accounts” that should be notified of any service state change. Create a new notification account inside your configured notification channel.

- Define the receiver’s e-mail address and the service elements (service group, service, service check) that you want to be notified of any status change (you can select on which status change this account should be notified).
- Additionally you can select log pools if you want to get notified on any feedback escalation sent for that application monitored with that log pool.
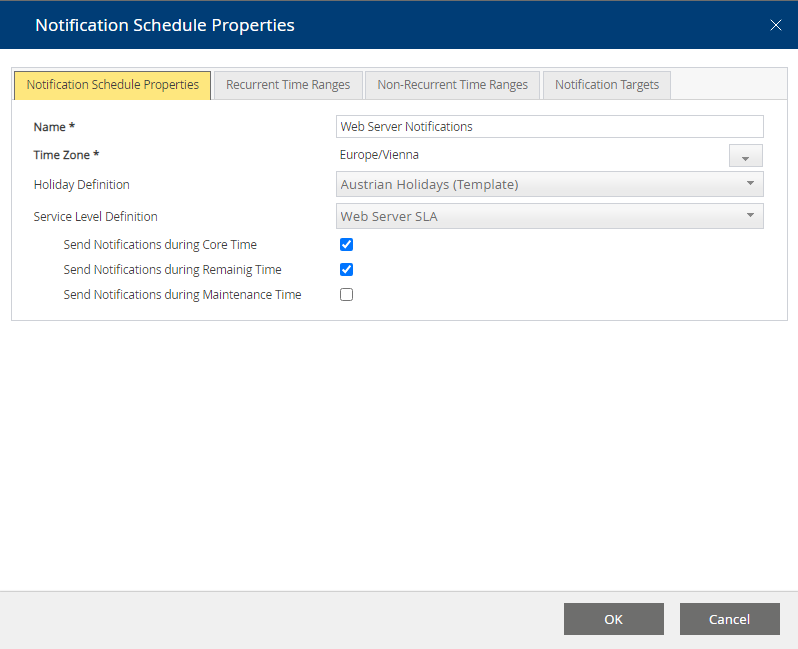
Configure Notification Schedules
Since Fabasoft app.telemetry 2010 Fall Release you could additionally define “Notification Schedules” for complex situations that require fine-grained notification settings based on SLA and holiday definitions and maintenance times.
Notification schedules define additionally to the notification account settings (“Notification Account Active” and “Notify when status changes to … OK|Warning|Critical”) when a notification for a specific notification target (service group, service, service check, …) is to be sent.
Notification schedules are based on a time zone, holiday definition and service level definition which help you to prevent sending of notifications during maintenance time ranges defined in the service level definition.
Additionally to these basic settings you could also define time ranges where you do not want to send any notifications (e.g.: recurrent time ranges for a weekend day, or non-recurrent time ranges for a holiday).
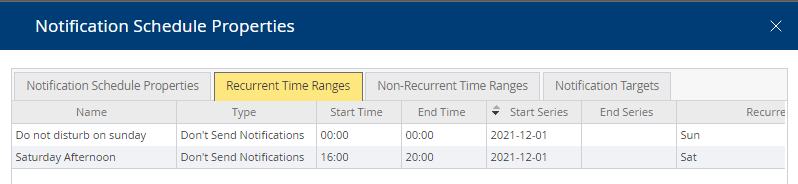
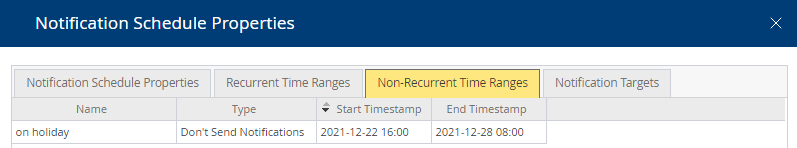
Note: The time range definitions for a notification schedule will take precedence over the time range settings in the used service level definition and non-recurrent time ranges also take precedence over recurrent time ranges.
Note: The notification schedule settings will only take effect if you specify valid notification targets. The notifications targets should match the targets configured for the notification account.
Configure Service Level Definitions
Service level definitions will help you monitor business critical services in order to fulfill defined service level agreements. Based on a service level definition, you can select service checks using this definition to monitor your service health. A service level definition requires a database to persist the service check state changes and a time zone which defines the base for all your time settings.
If you select to use a holiday definition then all holiday entries will be regarded as “remaining time” for the SLA calculations.
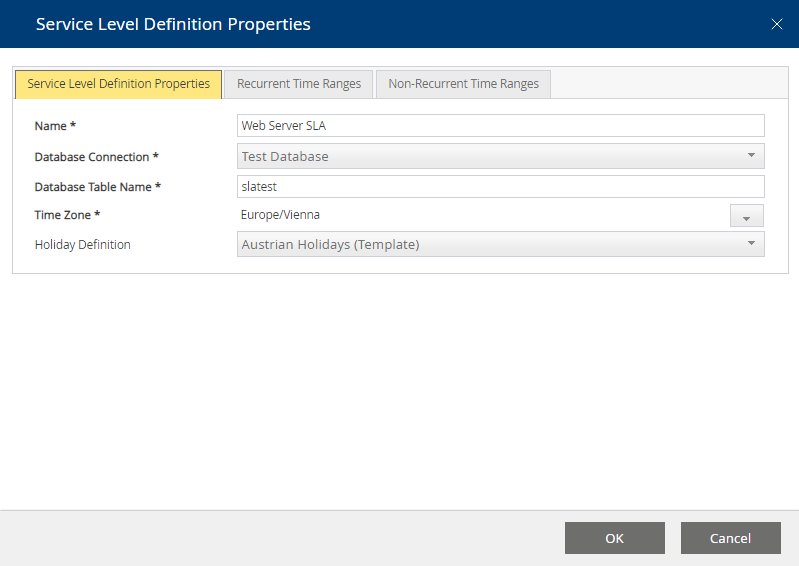
A reasonable service level definition requires the definition of a “core time”. Generally this is a recurrent time range based on time ranges for your weekdays.
After the service level definition is completely configured you can attach it to any availability service check.
Service checks with attached service level definition can be viewed in a dashboard chart to see the health in percentage of reached availability as defined in your SLA. (This needs to be configured explicitly.)
Using Dashboards and Charts
In order to create your own dashboard, switch the web browser client to the edit view and create a new “Dashboard” object below the root group “Dashboards”.
Note: “public” dashboards are available to all app.telemetry users whereas non-public dashboards are not available for app.telemetry dashboard users (so dashboard users can only view public marked dashboards and nothing else within the app.telemetry web client).
Chart and Data Source Types
Inside this new dashboard object you can create new charts for the following data source types:
- Availability Check
- Counter Check
- Software Telemetry Counter
- Request Duration Categories
- Top-X Reports
- Top-X Log Pool Statistics
- Service Group State
- CSV File
- Remote
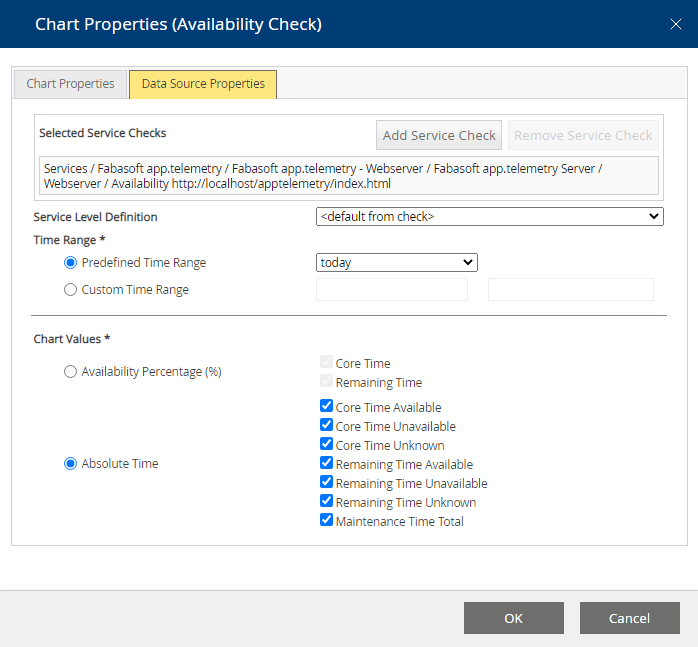
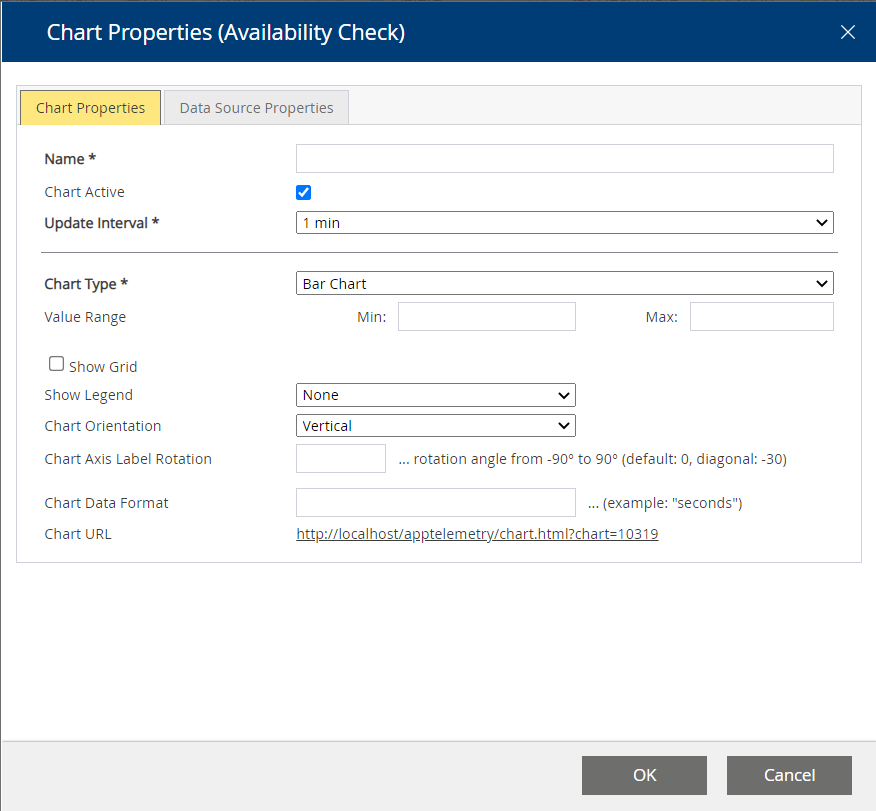
Availability Check Chart
For charts with data source type “Availability Check” you have to select a service check with attached service level definition by means of using the “Add Service Check” button and selecting the check from the infrastructure tree.
If you select more than one service check for your availability chart, the SLA calculation will interpret the service as available if at least one of the selected service checks is available.
You could overwrite the used service level definition with the combo box in order to use any specific SLA definition or select “<default from check>” to use the SLA configured in your (first) service check.
The time range can be one of list of predefined time ranges or a custom date range.
Depending on your desired presentation form you can select percentage values or absolute time values.
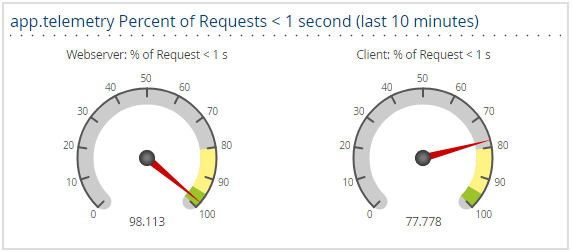
Counter Check Chart
For charts with data source type “Counter Check” you have to select one or a list of service checks by means of using the “Add Counter” button.
Additionally, you can decide on current values (for bar chart, gauge chart or similar) or a value trend (for line chart).
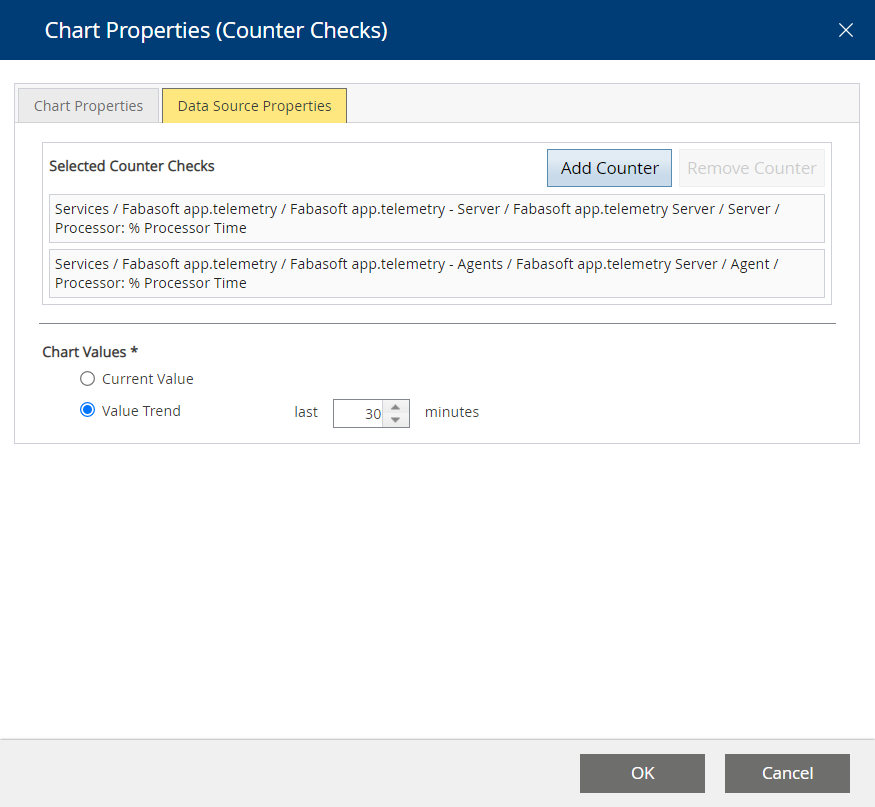
The counter checks can be reordered by means of using drag & drop with the mouse or by selecting a single check and press the keys CTRL+<key-up> to move the check upwards or CTRL+<key-down> to move the check downwards. The ordering of the checks will be reflected in the ordering of the checks in the graphical chart representation (order, color).
The time range of values available for the chart is limited by the time app.telemetry keeps counter data in memory. This time can be configured in the “Data Cleanup Settings” of the “Server Settings” object, where you can set the “Data Online Time (hours)”. For long term counters (e.g. disk space usage trends) you can select a database in the Service Check properties where to put the values on. The “Counter Check Chart” will automatically read counter check data from the database if online data are not sufficient. The available time range is limited by the maximum count of 1000 values per counter. Configure longer time intervals in the Service Check properties to extend the available time range in the chart.
Software Telemetry Counter Chart
With charts of data source type “Software Telemetry Counter” registered Software-Telemetry counters can be directly integrated into your dashboard.
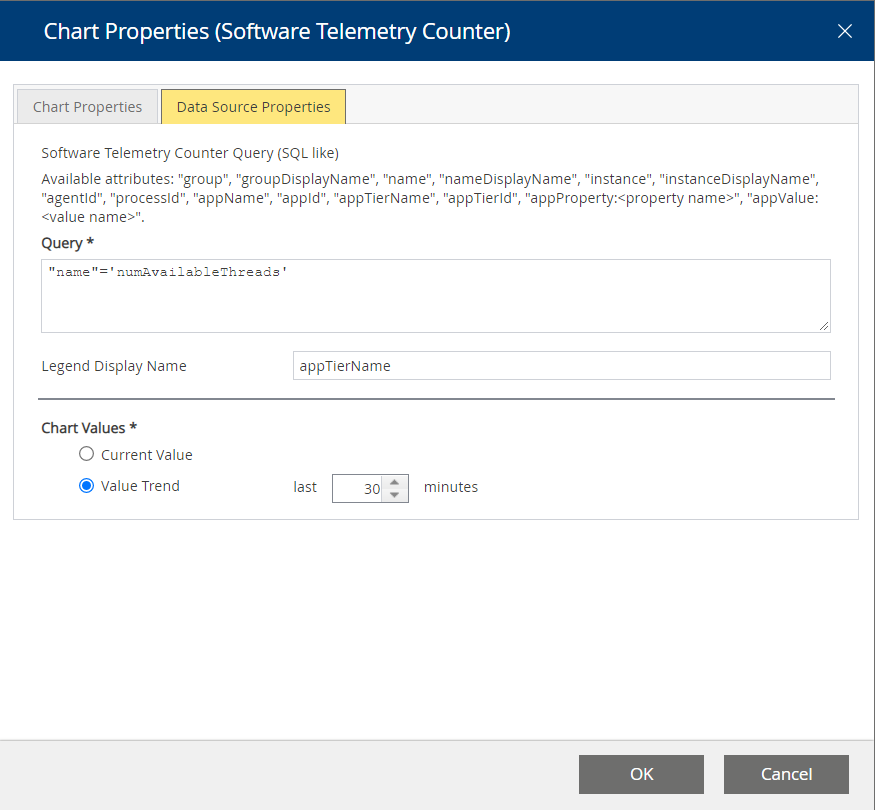
To select counters a SQL like query string is stated to filter all registered Software-Telemetry counters for specific property values.
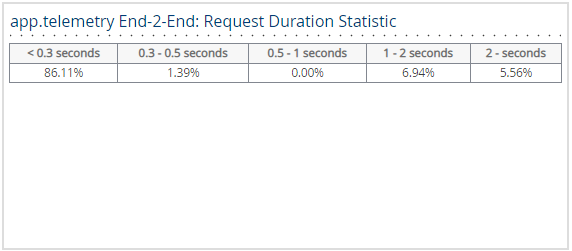
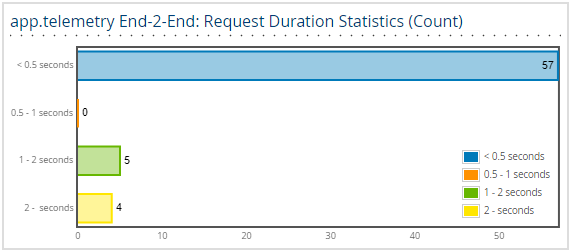
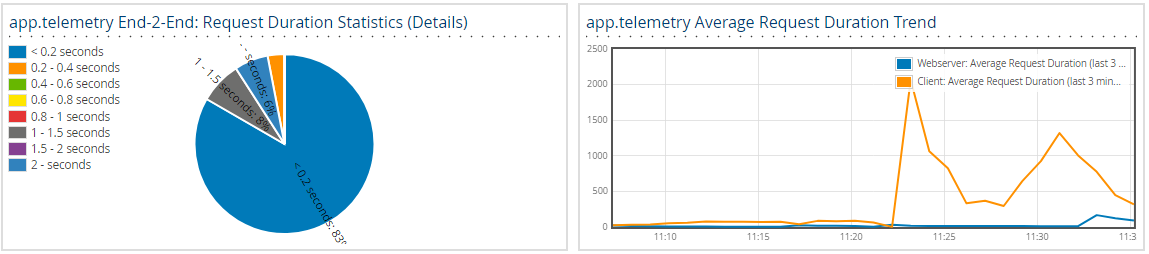
Request Duration Categories Chart
For charts with data source type “Request Duration Categories” you have to select a log pool and a list of request duration range classes to see how many requests for a defined time range class occur.
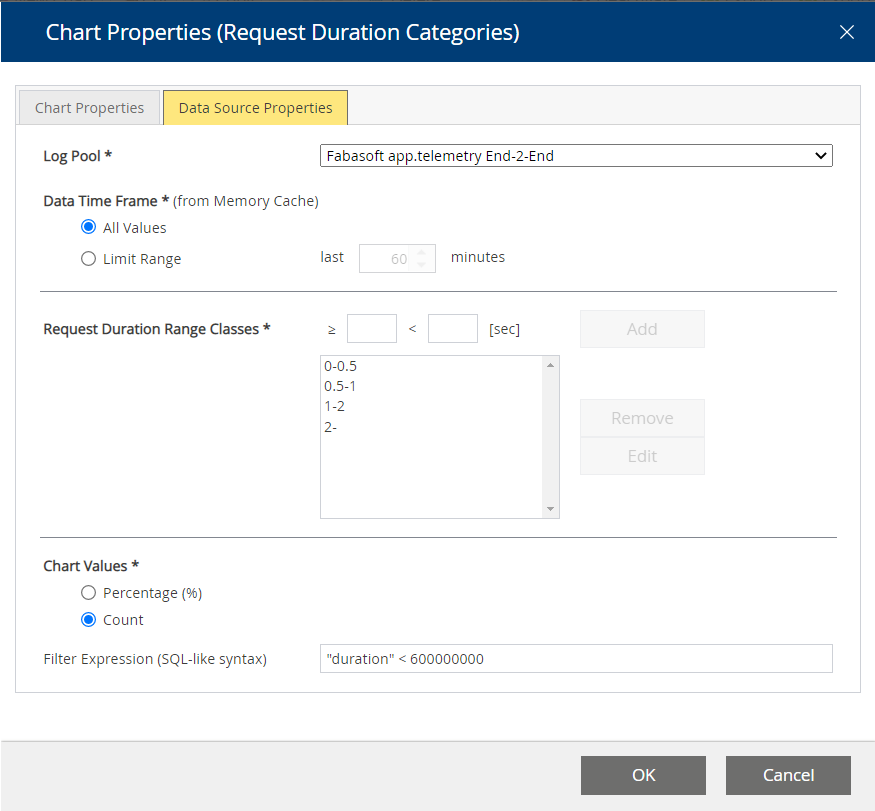
A popular representation for this type of chart is the pie chart.
Note: This data source/chart only shows requests from the log pools online memory cache (and not from database), so check your log pool settings if you see fewer requests than you expect.
With the optional filter expression, you can exclude some unwanted requests from your chart. The example in the screenshot above ("duration" < 600000000) includes (by means of an SQL WHERE-clause) all requests with duration smaller than 60 seconds, so it excludes requests with a timeout of 60 seconds or more. The filter is based on the internal data structures of the app.telemetry server, so the duration for example is based on a 100ns-timescale.
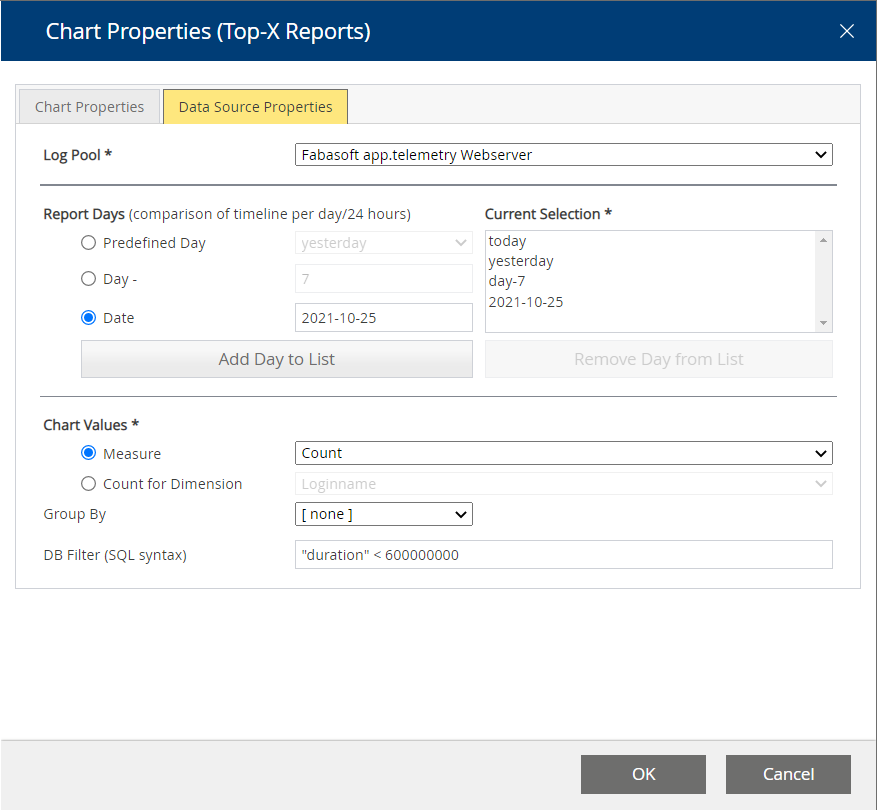
Top-X Reports Chart
For charts with data source type “Top-X Reports” you have to select a log pool for your Top-X report charts.
Then you have to select a list of days (the chart is presented as 24-hour line for each day compared in the same chart). So you can for example compare request duration or request count behavior for different days or against a defined baseline day.
The chart values define which measure or dimension (count of different dimension values) is used for the Top-X calculation.
With the optional filter expression, you can exclude some unwanted requests from your chart. The example in the screenshot below ("duration" < 600000000) includes (by means of an SQL WHERE-clause) all requests with duration smaller than 60 seconds, so it excludes requests with a timeout of 60 seconds or more. The filter is based on the internal data structures and database tables of the app.telemetry server, so the duration for example is based on a 100ns-timescale.
Top-X Log Pool Statistics Chart
Since version 2014 Spring Release the configuration of Top-X log pool statistic charts have been improved a lot. First of all, you have to enable statistic reports for your log pool (using “Precalculated Statistics”) and then you can create a new chart of type “Top-X Logpool Statistics” and choose the desired values from the combo boxes as shown in the example dialog below.
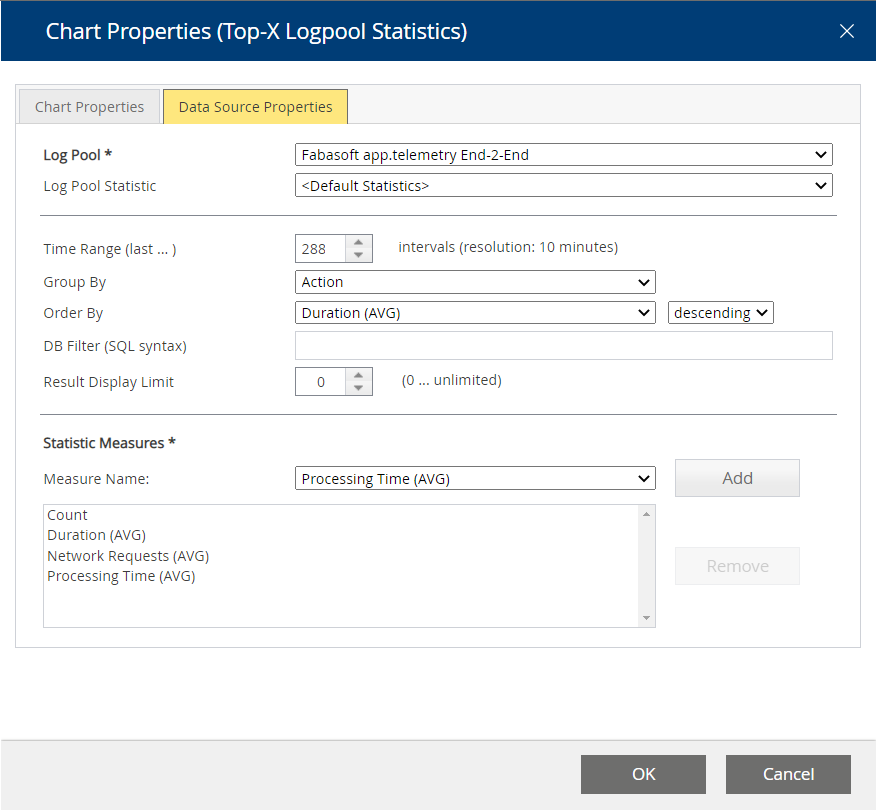
For special purpose you could still create and use your own log pool statistic definition (based on a log pool and a database) defining how some special statistics are calculated. A knowledgebase article (“Log Statistics”) describes this extended usage more detailed – for more help contact the Fabasoft support.
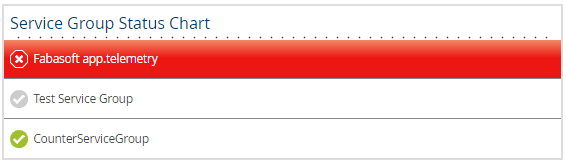
Service Group State Chart
For charts with data source type “Service Group State” you have to select a list of service groups you want to explicitly see in the dashboard view for this chart.

The counter checks can be reordered by means of using drag & drop with the mouse or by selecting a single check and press the keys CTRL+<key-up> to move the check upwards or CTRL+<key-down> to move the check downwards. The ordering of the checks will be reflected in the ordering of the checks in the graphical chart representation (order, color).
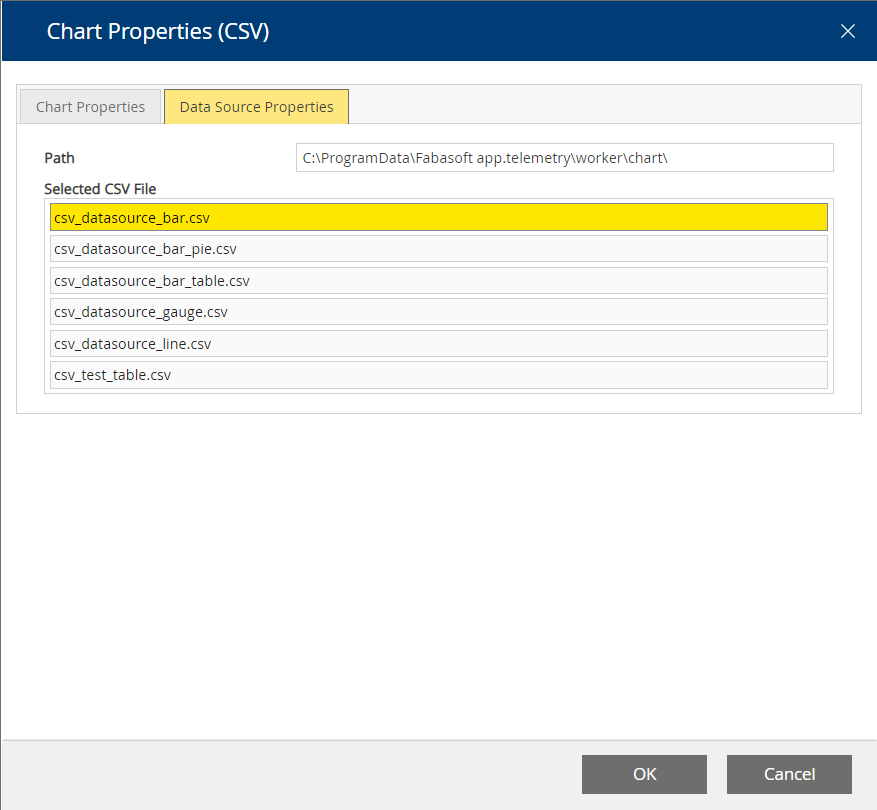
CSV Chart
Using CSV files, you may integrate data from various data sources into your dashboard.
Put your data in a file in the following directory
- C:\ProgramData\Fabasoft app.telemetry\worker\chart (Microsoft Windows)
- /var/opt/app.telemetry/worker/chart (Linux)
The CSV file content has to be of following format:
- The first line contains the column description – with quoted labels separated with semicolons.
- The first column contains the time dimension (if applicable) – if you don’t use time-based values skip this column with a leading semicolon in every line (also in the first header line)
Values must be separated by semicolons (";")
Quote text with double quotes (") and duplicate double quotes inside quoted texts.
The following example shows a CSV data file with time-based data. The time-series (first column) does not have a header (first cell in first row empty – leading semicolon) but all data rows start with a timestamp entry. This format can be used for line-charts or tables.
Example: CSV Chart Data File (time-based) |
|---|
;"Data Set 1";"Data Set 2" "2010-01-15";"680";"419" "2010-01-16";"702";"458" "2010-01-17";"745";"491" "2010-01-18";"820";"516" |
The following example shows a CSV data file with data that is not time based by skipping the first column with a leading semicolon (;) in every line. This format can be used for bar-charts, gauge-charts, pie-charts or a simple table.
Example: CSV Chart Data File (not time-based) |
|---|
;”Disk C:\”;”CPU (Total)”;”Memory”;”Network” ;75;88;77;12 |
General Chart Properties
Depending on the selected data source and data properties different chart types with different chart properties are available:
- Line Chart
- Bar Chart
- Pie Chart
- Gauge Chart
- Table
- Status List
Dashboard View
In the dashboard view you can select which dashboard to view, with how many columns your dashboard should display your charts.
The dashboard view can be locked to prevent unintended modifications. In order to change the number of chart columns, the position and size of charts or to add or remove charts just click the “Unlock Dashboard” button to enable modifications.
To hide or remove a chart from your dashboard, just click the remove button in the top-right corner of a chart.
In order to add any hidden charts again to your dashboard use the “Add Chart” button. This will open a dialog to select the displayed charts.
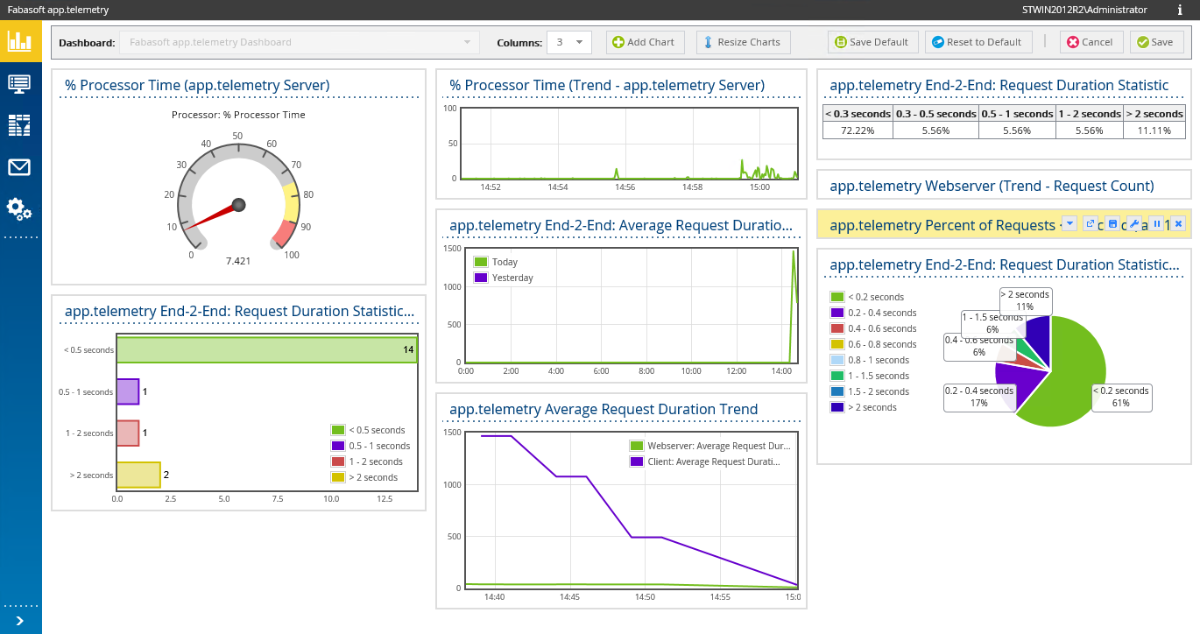
You can reorder (drag&drop on the chart title bar) or resize the charts simply with the mouse. Your arranged set of charts can be saved as default initial setting for all new users viewing this dashboard with the “Save Default” button.