

Feature Details
This chapter contains technical and informational descriptions for features of Fabasoft app.telemetry not described in the “Installation Guide” or somewhere else.
Special Notification Channels (Command Line)
The Fabasoft app.telemetry notification system is based on a notification channel defining the way how to send a notification and several notification accounts which are notified of status changes. The following notification channel types are supported:
- SMTP (E-Mail server)
- Microsoft Windows: directly via SMTP
- Linux: indirectly via local sendmail process (sendmail is usually provided by postfix)
- Command Line: using any defined command line to send a notification
To set up the notification system correctly you have to create a notification channel first and then create sub elements of type notification account inside the notification channel.
Command Line Notification Channel:
Create a notification channel, choose "Command Line Notification" and define the notification command line to be executed on any status change. The command line consists of the absolute path of the command or script (on the Fabasoft app.telemetry server) and additional parameters passed to the command or script. Parameters with spaces must be quoted ("). The following variables can be used to pass concrete values to the notification command:
- %FILE … will be replaced with the temporary filename of the notification template filled with the current values of the current notification.
- Example: "/tmp/app.telemetry/128920567310000000_1247583131572241.tmp"
Note: On Linux a systemd feature called PrivateTmp is used which means that /tmp as seen by this script is not the same as /tmp visible to other services or users.
- Example: "/tmp/app.telemetry/128920567310000000_1247583131572241.tmp"
- %TO … will be replaced with the "TO"-address of every configured notification account.
- Example: "0664123456789"
- %SUBJECT … will be replaced with the current notification subject value.
- Example: "Service Check \"crond availability check\" changed to ok"
- %AGENTHOSTNAME … will be replaced with the hostname of the agent where the status change came from (if possible).
An example of such a command line looks like:
Example: Command Line Notification |
|---|
/path/to/script.sh %FILE %TO %SUBJECT %AGENTHOSTNAME … this will result in the following call: /path/to/script.sh |
Set Timing Options for Notifications:
For some situations or in special installations you may need to tune some timing options for the notification system:
By default notification status is processed every 10 seconds starting 60 seconds after the app.telemetry Server service started. You may modify these settings by adding attributes to the respective NotificationChannel element in the infra.xml. To modify the notification interval, add an attribute scheduleSeconds with a value between 1 and 600 in seconds as the interval. To modify the time between the service start and the first notification, add an attribute delayOnStartSeconds with a number of seconds to wait between 0 and 3600. These two parameters cannot be changed at runtime
Example: Notification Channel Configuration |
|---|
<NotificationChannel id="100123" name="Mailserver" status="0" type="smtp" delayOnStartSeconds="300" scheduleSeconds="20"> <Param key="Authenticate" value="Anonymous"/> </NotificationChannel> This configuration will delay the notification processing for 5 minutes after server start (instead of 1 minute default) and process the notifications every 20 seconds (instead of default every 10 seconds). |
Notification Templates
Fabasoft app.telemetry allows customization of notification templates. The default notification template files are located inside the template sub directory of the installation directory:
- Microsoft Windows: %PROGRAMFILES%\Fabasoft app.telemetry\templates\
- To customize such a template copy it into the %PROGRAMDATA%\Fabasoft app.telemetry\ directory and apply your customizations there, changes to the files in the installation directory will be overwritten on every update.
- Linux: /opt/app.telemetry/templates/
- To customize such a template copy it into the /etc/app.telemetry/ directory and apply your customizations there, changes to the files in the installation directory will be overwritten on every update.
Those template files support some substitution variables that will be replaced with the current value for that notification. These variables are written in the templates with following escape-syntax: "<%VARIABLENAME%>" (e.g.: <%TIMESTAMP%>).
Status-Change Notification Templates:
The following substitution variables exist for status-change notification templates:
- NOTIFICATIONCLASS: element type responsible for notification change (Service Group, Service or Service Check)
- NAME: name of element responsible for notification change
- STATUS: current status of element type responsible for notification change
- PREVIOUS_STATUS: previous status before this status change (status changed from PREVIOUS_STATUS -> to STATUS)
- LOCALTIMESTAMP: timestamp when the status change happened (in local time - time zone set on app.telemetry server)
- TIMESTAMP: timestamp when the status change happened (in UTC)
- SUBNODES: hierarchical structure of nodes affected with this status change ... for details see example below
Example: Status Change Notification Template (commandlinetemplate.txt) |
|---|
<%NOTIFICATIONCLASS%> "<%NAME%>" changed to <%STATUS%> Fabasoft app.telemetry notification Message The status of <%NOTIFICATIONCLASS%> "<%NAME%>" changed from <%PREVIOUS_STATUS%> to <%STATUS%>. Date: <%LOCALTIMESTAMP%>, <%TIMESTAMP%> <%SUBNODES%> Reason <%GROUP%> Service group "<%NAME%>" reported status <%STATUS%> <%/GROUP%><%SERVICE%> Service "<%NAME%>" on agent <%HOSTNAME%> reported status <%STATUS%> <%/SERVICE%><%CHECK%> Service Check "<%NAME%>" reported <%VALUE%> <%MESSAGE%> <%/CHECK%><%SERVICEPOSTFIX%> -- <%/SERVICEPOSTFIX%><%GROUPPOSTFIX%> --- <%/GROUPPOSTFIX%><%/SUBNODES%> |
Escalation/Feedback Notification Templates:
The following substitution variables exist for status-change notification templates:
- SUBJECT: "Feedback Notification for Application <LOGPOOL> from <USER>" ... contains the user (name/email) of the user who submitted the feedback and the application/Log Pool where the feedback belongs to
Since product version 2014 Fall Release you can also customize the notification e-mail subject by means of replacing the predefined <SUBJECT>-tag with a custom template value consisting of raw text in combination with any desired other property value.
Here is an example based on feedback forms having a field with name “Message”:
<title>Feedback via form <%FORMNAME%> from user <%FROM%> with message: <%PROPERTY%>Message<%/PROPERTY%></title>
- MESSAGE: the message entered by the user with his feedback
- FROM: "name <email>" using feedback field "name" and field "email" to fill this values
- URL: the web page URL the feedback was sent from
- FILTER: session filter that was used for the feedback session
- LOCALTIMESTAMP: timestamp when feedback was submitted (in local time - time zone set on app.telemetry server)
- TIMESTAMP: timestamp when feedback was submitted (in UTC)
- LOGPOOLNAME: name of the Log Pool/application where the feedback belongs to
- LOGPOOLID: internal ID of the Log Pool/application where the feedback belongs to
- SESSIONID: session ID of this feedback
- APPLICATIONNAME: appname of registered application which triggered the feedback session
- APPLICATIONID: appid of registered application which triggered the feedback session
- APPLICATIONTIER: apptiername of registered application which triggered the feedback session
- FORMNAME: name of feedback form which triggered the notification
- SESSION_PROPERTY_LIST: a list of all additional feedback property fields
- PROPERTY: to obtain the value of any desired session property using <%PROPERTY%>property-name<%/PROPERTY%>
- ADD_FILES_AS_ATTACHMENTS: adds all in the feedback containing files (screenshot, systeminfo) as e-mail attachment to the mail notification. The location of this tag in the template is not relevant as it is not inlined but added as attachment.
Example: Escalation/Feedback Notification Template (escalationmailtemplate.html) |
|---|
<html> <title><%SUBJECT%></title> <style type="text/css"> </head> <body> <h1>Fabasoft app.telemetry feedback notification</h1> <h2>Message</h2> <h2>Date</h2> <h2>Application</h2> <h2>Sent by</h2> <h2>Sent from</h2> <h2>Feedback Infos</h2> <h2>Open/View Feedback Session</h2> </body> <%ADD_FILES_AS_ATTACHMENTS%> |
Fabasoft Folio Object Address Resolution
Fabasoft Folio object addresses (a.k.a. COO-addresses) are exact but quite meaningless in respect to the character of the object they represent. It is mainly for the sake of optimization that the Fabasoft app.telemetry instrumentation of Fabasoft Folio uses the 64-bit integer representation of the addresses to pass object identity information. Whereas the conversion to the "COO-Address" format has been coded into Fabasoft app.telemetry, a more user friendly way of presenting Fabasoft Folio objects is still available.
Mapping of addresses to Names and References:
Providing an XML file containing a mapping from object address to names or references Fabasoft app.telemetry can represent Fabasoft Folio addresses in human readable format to help users to interpret recorded request information more easily.
Generating the mapping file:
In order to generate the mapping file the "Integration for app.telemetry Software-Telemetry" Software Component provides the XSL Transformation file FSCAPPTELEMETRY@1.1001:GenerateLogAnalyzerData. Calling this XSL Transformation by a script or by a Fabasoft Expression you receive an XML file containing the addresses and names of the following object classes:
- Software Product
- Software Component
- Component Object (and all derived object classes)
- User
- Group
- Domain
To generate the mapping file start a command line (cmd.exe (Microsoft Windows) or bash (Linux)) on a Fabasoft Folio Server of your domain with a Fabasoft Folio service user account having permissions to read all objects, set the HOST and PORT variable to point to the Fabasoft Folio backend service and execute the following command (call the fsceval command in one line):
On Linux systems the default service user account is fscsrv and the default port of the Fabasoft Folio backend service is 18070. The fsceval binary is located under /opt/fabasoft/bin/ but should already be available via the PATH-variable without an absolute path.
Run fsceval (on Linux) to generate address resolution mapping file. |
|---|
su – fscsrv HOST=localhost PORT=18070 fsceval -eval "coouser.COOXML@1.1:XSLTransformObject(coouser, |
On Microsoft Windows systems you should be logged in with an administrative account (of Fabasoft Folio). Setting the HOST (default: localhost) and PORT (default: 18070) environment variables is optional and not required for a default installation.
Run fsceval (on Microsoft Windows) to generate address resolution mapping file. |
|---|
fsceval.exe -eval "coouser.COOXML@1.1:XSLTransformObject(coouser, |
Note: In earlier Fabasoft Folio or Fabasoft eGov-Suite installations the component name was FSCAPPLSTRUDL@1.1001 instead of FSCAPPTELEMETRY@1.1001.
The result is a generated fscdata.xml for your domain:
Syntax of fscdata.xml mapping files |
|---|
<?xml version="1.0" encoding="UTF-8" standalone="no"?> <Objects> <Object id="COO.1.1.1.2500" name="Fabasoft Folio/Base" reference="ComponentBase@1.1"/> <Object id="COO.1.1.1.9285" name="Fabasoft Folio/Folio" reference="ComponentFolio@1.1"/> ... </Objects> |
In earlier versions of the XSL-transformation script shipped with the app.telemetry Software Component some more additional properties (<Attributes>-sublist and <Methods>-sublist below the <Object>-tags) have been generated which are not used for the address resolution and name mapping and can be skipped. The only required entries in the mapping file for name- and reference-resolution are the <Object …/>-tags. To remove those not needed old sublist elements you can use grep to exclude all <Attributes>-sublist and <Methods>-sublist entries:
Exclude not used attributes from mapping file (optional) |
|---|
grep -v "<Attribute" fscdata.xml | grep -v "</Attribute" | grep -v "<Method" | grep -v "</Method" > fscdata-small.xml |
Set up Fabasoft Folio address resolution for Fabasoft app.telemetry:
The Fabasoft app.telemetry web browser client receives the formatted values from the Fabasoft app.telemetry web service, which is therefore responsible for the formatting of the addresses. This implies that the mapping file has to be stored in the configuration folder on the web service under the following path:
- Linux: /etc/app.telemetry/fscdata.xml
(ensure that the apptelemetryworker user can access/read the file) - Microsoft Windows: %PROGRAMDATA%\Fabasoft app.telemetry\fscdata.xml
(ensure that the app.telemetry Worker user can access/read the file)
Restart the Fabasoft app.telemetry Worker service to read the new content of fscdata.xml.
Since Version 19.1 you can upload a new fscdata.xml file in the Fabasoft app.telemetry web browser client using the “Upload Mapping” action in the Application view. The existing fscdata.xml will be replaced and immediately applied without a restart of the Fabasoft app.telemetry Worker service.
Since Version 19.1 the upload of the fscdata.xml is also supported using an HTTP POST request.
Upload fscdata.xml using curl |
|---|
curl -u username:password --header "content-type: application/xml" --url http://localhost/apptelemetry/server/UploadMapping --data-binary @fscdata.xml |
The decision whether the COO-address is mapped to the objects name or reference is defined in the log definition of the corresponding log pool by the column “format” with the values:
- format="fsc:address" … pretty-print the COO-address
- format="fsc:reference" … print the reference value of the object if found in mapping file (fall-back: COO-address)
- format="fsc:name" … print the name value of the object if found in mapping file (fall-back: COO-address)
Merging of Multiple Mapping Files
In special situations one Fabasoft app.telemetry server may be used to monitor multiple Fabasoft Folio domains (e.g. test domain and production domain). Currently the app.telemetry server only supports one global address resolution mapping file (as described in the main chapter).
The solution to get Fabasoft Folio object addresses of different domains resolved together is to merge the separate mapping files (generated for each Fabasoft Folio domain) into one single mapping file.
- Generate the separate mapping files for each Fabasoft Folio domain
- Resulting in several fscdata.xml files (e.g.: fscdata1.xml, fscdata2.xml, fscdata3.xml, fscdata4.xml)
- Remove the basic XML-file header (line 1) and surrounding <Objects>-list XML-tags (line 2 and last line)
- First file (fscdata1.xml): remove the end tag </Objects> from last line of the first file
- File 2 … <n-1> (fscdata2.xml, fscdata3.xml): remove XML-header and <Objects>-start-tag and </Objects>-end-tag
- File n (fscdata4.xml): from the last file only remove the XML-header and <Objects>-start-tag
- Concatenate all files in the same order: ”cat fscdata1.xml fscdata2.xml fscdata3.xml fscdata4.xml > fscdata.xml”
Or just copy all plain <Object>-entries without any surrounding container-tags into 1 single file with the syntax shown in the following example:
Syntax of fscdata.xml mapping files |
|---|
<?xml version="1.0" encoding="UTF-8" standalone="no"?> <Objects> <Object id="COO.1.1.1.2500" name="Fabasoft Folio/Base" reference="ComponentBase@1.1"/> <Object id="COO.1.1.1.9285" name="Fabasoft Folio/Folio" reference="ComponentFolio@1.1"/> ... </Objects> |
Note: Be careful with the file encoding – ensure to edit and save the file with valid encoding (UTF-8).
Duplicate <Object>-mapping definitions may occur in the merged file but doesn’t matter. The first <Object>-definition for an id (COO-address) is used to resolve the entry.
Upload Mapping Files with Command Line
Since Version 2022 UR2 the command line supports uploading or merging the fscdata.xml file with the following command:
Upload Mapping file using Command Line |
|---|
apptelemetry mapping upload fscdata.xml or apptelemetry mapping merge fscdata.xml |
When merging mappings, the entries will replace existing entries and the merged fscdata.xml file will be updated on the server.
Download fscdata.xml from Folio Webservice
With 2022 November Release Folio provides a web service URL to download the fscdata.xml form a Folio webservice:
Download fscdata.xml from Folio Web Service |
|---|
curl -u username:password -o fscdata.xml \ https://folio.mycompany.com/folio/apmgeneratemapping/fscdata |
Incremental update can be a acquired passing a valid timestamp as an optional changedat parameter as in:
Download incremental fscdata.xml from Folio Web Service |
|---|
curl -u username:password -o fscdata.xml \ https://folio.mycompany.com/folio/apmgeneratemapping/fscdata?changedat=2022-10-22 |
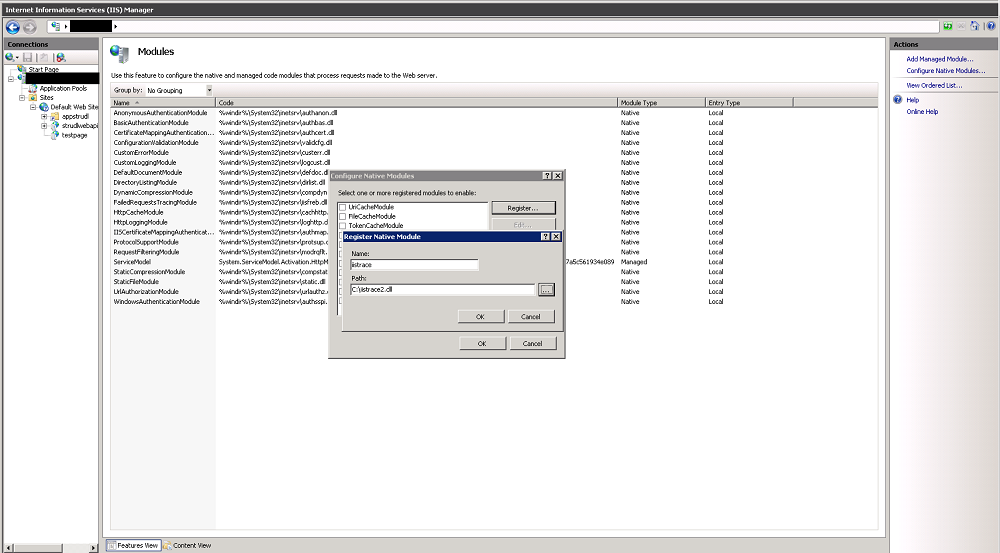
Configure Software-Telemetry Module for Microsoft IIS
With the native Software-Telemetry module for Internet Information Services (IIS) Fabasoft app.telemetry can log each HTTP-request with some important parameters to a separate Software-Telemetry log pool or the data is shown as extension module in the requests of an involved log pool of another web application. The module shows the start-, and end-time of each request, the time needed for authorization and execution and additional request parameters
Configuration:
To install the module on Microsoft IIS7 web server follow these steps:
- Get the module files from the app.telemetry installation media from the directory “Telemetry-Modules\WINDOWS_Xxx”
- Place the telemetryiis7.dll in any folder on your file system and give it the needed permission settings (the configured user of the web applications application pool must have read and execute access to the file).
- Open IIS Manager and move to the root node of your web server
- Select and enter the "Modules" feature.
- Click on "Configure native module" inside the action pane on the right edge of IIS manager.
- Click on "Register" in the new configuration dialog.
- Fill in a custom name and the path of the .dll file into the required fields and commit by clicking OK.
- Disable the module on the root level.
Enable the module for your web application:
- Navigate to your web application in IIS manager and enter the "Modules" feature.
- Click on "Configure native module" inside the action pane on the right edge of IIS manager.
- Enable the module in the configuration dialog.
Note: You can enable the module only for your web application or for the complete web site, but be careful not to enable the module on two configuration layers because this will lead to a duplicate error.
Enable context transitions for Browser-Telemetry:
The IIS-Software-Telemetry module supports End-2-End Software-Telemetry by providing a context in a session-cookie. Use the following steps to enable this feature:
- Configure the IIS schema
- stop IIS (iisreset /stop)
- copy apmmodule_schema.xml from the “Telemetry-Modules\WINDOWS_Xxx” directory to %windir%\system32\inetsrv\config\schema
- edit %windir%\system32\inetsrv\config\applicationHost.config to include the "apmModule" section under the "system.webServer" sectionGroup:
<sectionGroup name="system.webServer">
<section name="apmModule" overrideModeDefault="Allow" />
… - start IIS (iisreset /start)
- Use Internet Information Service (IIS) Manager to configure the Fabasoft app.telemetry IIS module
- select the respective web site or virtual directory where you want to enable context transitions (you should enable this feature on virtual directories providing instrumented html files)
- double-click "Configuration Editor" from the "Features View"
- select "system.webServer/apmModule" in the "Section" property
- change the value of "provideContext" to “True“
- click "Apply"
Generic Log Definition Columns
Since Fabasoft app.telemetry 2012 Spring Release log pools and log definition columns have been extended to be more powerful and flexible than before.
Log definition columns can be defined as generic/dynamic columns based on other columns obtaining their value by means of evaluating a calculation formula.
Possible calculation types are:
- categorize value
- split value (regular expression)
Categorize Value
To categorize an existing log definition column value, decide which parent/base column you want to split up into reasonable value categories. This column is defined in the new column definition as parent-attribute containing the name of the chosen existing column. You can also choose internal columns like the duration column.
The next step is to define the split points how to separate the value into the categories using the calculation-attribute. If you define 3 split points, you will get 4 categories: below the 1st split point, between 1st and 2nd, between 2nd and 3rd and above the 3 split point.
Then you can define textual labels for the categories using the format-attribute containing the keyword "enum:" followed by the number of the category, a colon (:) and the label text separated with a semi-colon (;) from the next category.
Last but not least set the flags of the new defined column including the flag for a CALC_VALUE_CATEGORY = 0x10000 (decimal=65536). If you want to define the column to be a dimension-column you also have to include that flag (0x0100 / decimal=256).
Syntax for Categorize Value |
|---|
calculation="x1;x2;x3" format="enum:1:0-x1;2:x1-x2;3:x2-x3;4:>x3" parent="name of parent column" name="Category Column Label" flags="65792" |
Split Value (Regular Expression)
To split an existing log definition column value into sub parts, decide which parent/base column you want to split up. This column is defined in the new column definition as parent-attribute containing the name of the chosen existing column.
The next step is to define the regular expression splitting up the existing string into a new value using the calculation-attribute:
- Enclose the desired text part in the regex with grouping braces “( … )”
- Define the desired group match number with the paramid-attribute (first/only 1 matching group ... paramid="1").
Last but not least set the flags of the new defined column including the flag for a CALC_REGEXP = 0x20000 (decimal=131072). If you want to define the column to be a dimension-column you also have to include that flag (0x0100 / decimal=256).
Example: Web Timing Dynamic Columns |
|---|
<APMLogAnalyzerEntry name="Response Time Category" parent="duration" <APMLogAnalyzerEntry name="Protocol" parent="Page URL (referer)" <APMLogAnalyzerEntry name="URL Path" parent="Page URL (referer)" |
Log Statistics (Daily Statistics)
Since Fabasoft app.telemetry 2012 Spring Release a new database-based statistic feature is available which allows you calculate defined statistics on the available data at a defined time.
For example you can calculate and summarize all the requests from the last day every night and generate significant statistic charts.
Feature Details:
The new log statistics are based on the following components:
- An application log pool defining which data is recorded.
- A database selected in the log definition storing the basic data (full base data set) and the statistic tables.
- A log statistic defining which data is calculated at which time in which way.
- A chart based on that log statistic representing the summarized/calculated data.
The Log Statistic object defines the following key facts:
- A time resolution (in minutes) defining the interval when the statistic is calculated.
- A time schedule defining the delayed offset (in minutes) after the interval when the statistic is calculated
- A database table extension (tableext) that is appended to the new created statistic database tables (belonging to the database assigned in the log pool). This value must be unique for the statistics selected for a single logpool.
- A list of dimension fields. The statistic result may be grouped by the given dimensions (see "group by" in the chart).
- Optional database filter defining which requests should not be included for the statistic calculation (the filter has to be defined in SQL syntax, e.g. "duration < 600000000")
The Top-X Logpool Statistic Chart defines the following key facts:
- The log pool where the base data is taken from
- The log statistics where the calculated chart data is taken from
- A time range defining how many time intervals will be calculated
- group by field. Select the dimension from the Log Statistic dimension field by which to group the values by.
- Optional database filter defining which requests should not be included for that chart (the filter has to be defined in SQL syntax and may only cover dimensions included in the Log Statistic)
- A list of displayed measures defining which measures will be shown in the chart
- In Chart Data Mode you can specify the time column format (“date”, “time”, “datetime”) if the chart type is “Table”, use “summary” to get a single summary record.
Configuration Details
The basic configuration can be done via the app.telemetry client (GUI) interface on the edit view.
- Check if your application log pool has a database assigned
- Create a new log statistics object and define all required fields
- Create a new chart - select "Top-X Logpool Statistics" as data source - and define all required fields
TCP Transport for Agent-Library Communications
Since Fabasoft app.telemetry 2012 Summer Release a new transport channel for app.telemetry agent/library communication is available.
Before this feature was introduced telemetry data could only be sent to the app.telemetry agent via a native library using shared-memory communication which limits application instrumentation on the supported platforms of the app.telemetry agent.
In order to extend the support for other platforms (for application instrumentation) we have introduced the TCP transport channel which can be used to transport the telemetry data from any Java platform (also with other hardware architecture).
Feature Details:
TCP transport channel is available for following app.telemetry libraries:
- Software-Telemetry C/C++ library (on supported app.telemetry Agent platforms)
- Software-Telemetry Java library (on any Java 8 or higher platform)
Configuration Details app.telemetry Agent
First of all you have to enable the TCP transport channel for any app.telemetry Agent in your infrastructure (default the agent does not listen for any TCP data).
Define the network port the agent should listen on for telemetry data in the app.telemetry agent configuration:
- Linux: /etc/app.telemetry/agent.conf: "TelemetryPort 10002"
- Microsoft Windows: Registry Key: \HKLM\SOFTWARE\Fabasoft app.telemetry\Agent\TelemetryPort = 10002 (DWORD - decimal)
Restart the app.telemetry agent daemon/service.
Configuration Details for C/C++ Library
In order to tell the native C/C++ Software-Telemetry library to communicate via TCP transport (instead of shared memory) with an app.telemetry agent, start the instrumented application with the following environment variable:
- APM_TRANSPORT=tcp://<agent-IP>:<port>
- for example: APM_TRANSPORT=tcp://localhost:10002
Configuration Details for Java Library
In order to tell the Java Software-Telemetry library to communicate via TCP transport (instead of communicating with the native library on the local system) with an app.telemetry agent, start the instrumented application with the following configuration parameters:
- either as Java system property at the startup command line of your instrumented application:
- -Dcom.apptelemetry.apm.transport=tcp://<agent-IP>:<port>
- or as environment variable:
- APM_TRANSPORT=tcp://<agent-IP>:<port>
- or as app.telemetry config property set via the app.telemetry Config tool:
- java -jar softwaretelemetry.jar
- to get basic help how to use this config tool call it with the param "help"
- java -jar softwaretelemetry.jar help
- to get more extensive help about the possible configuration parameters call it with the param "info"
- java -jar softwaretelemetry.jar info
- setting the transport as config property:
- java -jar softwaretelemetry.jar set configs/<myconfig> transport tcp://<agent-IP>:<port>
- and start the application with the config name with the Java property:
- -Dcom.apptelemetry.apm.config=<myconfig>
- or if using JVMTI start the application with the javaagent and the config name:
- -javaagent:softwaretelemetry.jar=config=<myconfig>
Optionally you can define a log file for debugging purpose as Java system property:
- -Dcom.apptelemetry.apm.logfile=<logfile-name.log>
- -Dcom.apptelemetry.apm.loglevel=debug|trace|default
- debug will cause many debug log messages
- trace will result in a huge amount of trace messages where almost everything is logged (for developer)
- any other loglevel value will result in normal logging (info, warning, error)
File System Counter Checks for Fabasoft Folio Internal Data
Fabasoft app.telemetry counter checks are a very powerful possibility to monitor arbitrary values of different (foreign) systems. One of those (foreign) systems (from the app.telemetry point of view) is Fabasoft Folio and the internal data structures.
With shell scripts you have still the possibility to obtain some internal data from Fabasoft Folio and with app.telemetry counter checks you can monitor those values obtained by some scripts writing the results into text files.
Some of the internal data of Fabasoft Folio can be obtained by executing the utility program fsceval on a Fabasoft Folio backend server (running as Fabasoft Folio service user).
- Write your Fabasoft Folio Kernel expression printing out the desired value at the end of the script into a text file <getvaluescript.exp>.
- Test your expression script with the tool fsceval running on a Fabasoft Folio backend server on behalf of a Folio service user (fscsrv): fsceval –nologo –file <getvaluescript.exp>.
You may have to specify the Fabasoft Folio host (HOST=localhost) and the port of the backend service (PORT=18070).
The script execution should print the value defined in the expression file. - “Grep” for the resulting value in the output and store the plain value into a text-file stored in the app.telemetry status-file folder readable for the app.telemetry agent service user:
fsceval -nologo -file <getvaluescript.exp> | grep value | awk '{print substr($3, 2, length($3) - 2)}' > /var/opt/app.telemetry/status/<fsc-value.txt>. - Create a new Fabasoft app.telemetry service check of type “Counter check using file system” and select the status file defined in your scripts. You should also harmonize the update interval of your file counter (cron job) with the check interval.
Note: Running these scripts as cron job may require some special environment handling:
- Ensure that the tool fsceval is in the PATH of the cron job script or call it with full path (/opt/fabasoft/bin/fsceval).
- Ensure that the LD_LIBRARY_PATH is set correctly
LD_LIBRARY_PATH=/opt/app.telemetry/lib64:/opt/fabasoft/share/eval:/opt/fabasoft/share/eval/INSTALLDIR/Domain_1_1:/opt/fabasoft/share/eval/INSTALLDIR/Domain_1_1001 - The expression file <getvaluescript.exp> has also to be passed with absolute path.
This may sound a little bit complex but the following two examples will help you understand and use this powerful feature:
Check Remaining Object Addresses in a Fabasoft Folio COO-Store
To monitor the count of free object addresses in a Fabasoft Folio COO-Store you may use the following expression and scripts:
1. Write the expression and save it to a file (objinfo.exp).
objinfo.exp: Expression for free addresses in COO-Store |
|---|
// Check all stores and write free addresses to a file per store // specify target path here @writenumbertopath = "/var/opt/app.telemetry/status/"; @svcs = coort.SearchLocalObjects3(cootx, "COOService"); @objremaining = 0; for (@i = 0; @i < count(@svcs); @i++) { @Storelist = @svcs[@i].coosrvinfo.cooinfmaxobjids; for (@j = 0; @j < count(@Storelist); @j++) { @Storeagg = @Storelist[@j]; if (@Storeagg.cooinfmaxcoost.objclass == COO.1.1.1.440) { @objremaining = @Storeagg.cooinfavailobjids; @cont = coort.CreateContent(); @cont.SetContent(cootx, 1, 65001, @objremaining); @cont.GetFile(@writenumbertopath + "freeids_" + @Storeagg.cooinfmaxcoost.objname + ".txt"); } } } |
2. Write a script to get and update the value, save it as shell script and test it (running as Folio service user on a backend server).
Test expression using fsceval |
|---|
su – fscsrv fsceval -nologo -file objinfo.exp |
3. Create new app.telemetry counter checks for each COO-Store to monitor the value from the status files and define the update interval and the warning/critical limits (for example: set a warning level for below 1000000 and a critical limit for below 100000) to be notified when the COO-Store is low on free object addresses.
Check Remaining Days until Fabasoft Folio License Expires
In order to get notified before your Fabasoft Folio license expires just follow this example.
1. Write an expression like the following to get the days until your license will expire and save it to a file (fsclicense.exp).
fsclicense.exp: Expression to check days until license expires |
|---|
@lics = coort.GetCurrentDomain().COOSWCLM@1.1:domainlicenses; for (@i = 0; @i < count(@lics); @i++) { @exp = (@lic.COOSWCLM@1.1:keyexpirydate - coort.GetCurrentDateTime(coouser)) / 3600 / 24; if (@exp < @expiryday) { @expiryday; |
Warning: In some situations you may not rely on the accuracy of the COOSWCLM@1.1:domainlicenses property of your current domain.
2. Write a script to get and update the value, save it as shell script and test it (running as Folio service user on a backend server).
Test expression using fsceval |
|---|
su – fscsrv fsceval -nologo -file fsclicense.exp |
3. Extend your script by means of “grepping” for the desired value in the output and storing the result into an app.telemetry status file and configure a cron-job to call this update script periodically.
Update shell script (update-license-expiration.sh) |
|---|
#!/bin/bash HOST=localhost LD_LIBRARY_PATH=/opt/app.telemetry/lib64:/opt/fabasoft/share/eval:/opt/fabasoft/share/eval/INSTALLDIR/Domain_1_1:/opt/fabasoft/share/eval/INSTALLDIR/Domain_1_1001 export HOST PORT LD_LIBRARY_PATH /opt/fabasoft/bin/fsceval -nologo -file /home/fscsrv/fsclicense.coo |
4. Create a new app.telemetry counter check to monitor the value from the status file and define the update interval and the warning/critical limits (e.g. warning below 30 days and critical below 5 days).
Data Retention Strategies for app.telemetry
Fabasoft app.telemetry provides different strategies for managing data retention.
Larger amount of data is stored by the app.telemetry Server continuously by the following services:
- Software-Telemetry request data … is stored in a database table for each log pool (1 record/request). Cleanup rules can be configured in the log pool configuration dialog.
- Software-Telemetry request detail data … is stored as rawdata on the file system in “daily”-directories (…/server/telemetry/<yyyy-mm-dd>). This kind of data is consuming much more disk space than the request records on the database.
Note: Do not delete the directory of the current day (without a full restart of all server processes). Instead you should use the automatic cleanup rules from the “Server Properties” dialog. - Precalculated log pool statistics … are stored beside the request database tables for each log pool.
- Software-Telemetry sessions … are stored on the file system containing request data and request detail data (rawdata). They are created on demand by a user or when a feedback is sent.
- Started/Stopped Server sessions are read from rawdata so they are available until rawdata of the respective time is being deleted. To keep the data permanently make sure to download the session as a zip file.
- Feedbacks will be automatically extracted from rawdata into zip files so that the feedback are available even after the rawdata have been cleaned up. Session zip files are deleted when the corresponding feedback is permanently deleted from the inbox.
- Uploaded sessions are stored as complete ZIP-archives containing all required data on the worker and are already independent from the rawdata directories.
- Counter check data can also be stored in a database table (1 record/check).
- Recorded status change records can be configured to be automatically deleted after x days via the global “Server Properties” (since version 14.2 configurable – before it was defined to be 1 month).
- SLA-relevant availability data information will never be deleted from the defined database.
- Activity statistic data … since version 2015 all telemetry requests are analyzed and statistical data (module and event activity statistics) is stored on the file system (…/server/telemetry/activitystats/). Cleanup strategies can be configured in the global “Server Properties” dialog.
In order to handle the increasing amount of data and prevent the disk from running out of free space you can configure automatic retention time periods within the app.telemetry client. For more details read the sub chapter “Cleanup Strategies”.
Note: Before starting to delete any data you should export Software-Telemetry server sessions and feedbacks by a special automatic app.telemetry server task (configuration setting) in order to access the request details of such sessions later on.
Automatic Export of Feedback Sessions
In most situations feedbacks should be available for a much longer time period than standard request detail data which will be held for post-problem analysis for some time. Therefore you can split off the detail data required for the feedbacks from the normal rawdata directories.
This feature will be automatically enabled after updating to version 2014 Spring Release or later unless it is explicitly disabled in the server configuration file. If you want to change this setting or the session export path stop the app.telemetry server daemon then open the configuration file of the app.telemetry server (/etc/app.telemetry/server.conf) and setup and activate the configuration parameter “SoftwareTelemetrySessionPath”:
# The SoftwareTelemetrySessionPath property defines the target location
# for extracting reported telemetry sessions from the raw data files. (optional)
# The default path is: /var/opt/app.telemetry/server/sessions
# To disable automatic session extraction uncomment the line below (set to empty)
SoftwareTelemetrySessionPath /var/opt/app.telemetry/server/session
After this configuration is activated you can start the app.telemetry Server daemon again.
After a while the server will start processing all available existing telemetry sessions and export them to the configured directory. This process may take some time depending on your infrastructure and on the number and size of reported sessions/feedbacks. You can watch the progress of that action by the increasing directory content size on the file system. This process is an ongoing process that will also export new incoming feedbacks a couple of minutes after they have been fully completed.
Cleanup Strategies
Within the Fabasoft app.telemetry client you can define different automatic data deletion rules in order to keep essential data for a defined time period but prevent filling up the disk with old data not required any more.
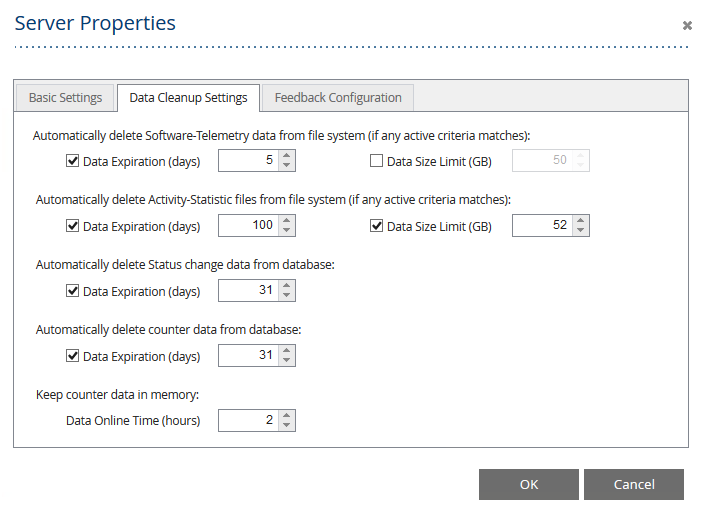
The most cleanup settings can be configured within the global “Server Properties” dialog (in edit view at the top of the infrastructure tree).
You can either limit the retention of the data by time as number of days. If you activate this cleanup rule, any data that is older than the defined time range will be deleted a non-deterministic time span later (please be patient after applying the changes and give the server some time to process the cleanup).
The other possibility to limit the amount of data (only available for file system based data) is to set a data size limit in gigabytes (GB). But be careful this limit is only an estimated size limit and can vary a little bit.
You can define a single type of limit for every kind of data or even both limits, which mean if your data match one of the two criteria the cleanup will be triggered to reduce the amount of data to fit the all criteria again.
The data retention for the Software-Telemetry request detail data (rawdata on filesystem) is used to reduce the big-sized data of old requests. It is your choice how long you want to keep request detail data for a detailed problem cause analyze (request overview, request details, request statistics, request grades) and depends on the amount of available disk space.
Warning: you should have exported the reported telemetry sessions/feedbacks as described in the last chapter otherwise those session details will not be accessible!
For long-term analysis of your applications you could still use the activity statics if you keep those data for a longer period than the request detail data.
Additionally you can configure a database retention time range for all log pools as parameter on every log pool configuration dialog:
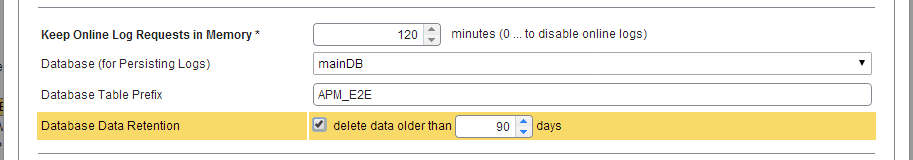
If you activate the database data retention for a given time range (in days) the following data will be automatically deleted from database tables belonging to that log pool:
- Software-Telemetry request data
- Precalculated statistics
The Status change data is required to show a table containing the history of all status changes of every service/counter-check. This history data is available for the time range defined in the cleanup settings of the “Server Properties”.
Service checks with a defined SLA-definition are persisted independently and unlimited in a database defined within the SLA-definition.
Counter checks with a defined database for persisting the counter results are also stored on the defined database. On the “Data Cleanup Settings” page of the “Server Properties” you may specify a “Data Expiration (days)” value to cleanup all counter values that are older than the given number of days (this option is available with Fabasoft app.telemetry 2015 Rollup 2).
Analyze Requests using Rules
Analyzing performance issues in requests – especially in distributed applications like Fabasoft Folio – is a time consuming task requiring a lot of application specific knowledge. To simplify this process, a set of rules is being created to identify common issues.
There are common rules applying to any Fabasoft app.telemetry instrumented application and rules specifically written for dedicated Products like Fabasoft Folio. In those rules common problems are identified by the telemetry data included in the request. Designing those rules is an evolving process where analyzing steps originally processed manually are being formalized and automated.
In order to use these rules for analyzing telemetry requests, open a request on the telemetry view and select the new “Grades” tab in the bottom analyzer area.
Analyze Entirely Completed Requests
This rule applies to any request generated by Fabasoft app.telemetry instrumented applications and simply checks, if all processing threads, which occur in this requests were correctly terminated.
There are several reasons why a request could be detected not to be finished:
- A request may be opened while still being processed. You may detect what the request is currently processing by looking at the end of the unfinished threads.
- A request may be too large to be processed. Try to reduce the amount of telemetry points per request by lowering the instrumentation level of the log pool or session.
- A process may have stopped working. The problem may be near to the last telemetry point of the unfinished thread.
- The instrumented application may not handle a failure (e.g. exception) correctly and so no ReleaseContext has been recorded.
Reduce RPCs to Fabasoft COO Service
The Fabasoft Web service communicates with the Fabasoft Backend Services using Remote Procedure Calls (RPCs). Each call requires at least one network roundtrip and the allocation of a backend service thread. Issuing too many calls will result in a delay mainly caused by the network latency. Replacing many small RPCs by fewer larger ones will save roundtrip time and management overhead on client and server side.
The grade of the rule will reflect the potential benefit of an improvement based on the fraction of time consumed by RPC requests in proportion to the total request time.
Thus the main info provided is the count and the duration of all RPCs executed. In addition the duration is split in the communication time and the execution time base on the time difference between the requests on the Fabasoft Kernel side and the execution on the Fabasoft COO Service side.
Especially when a high communication time is indicated, the COO Service RPCs are worth being further analyzed. Assuming that the Web Server and Backend Server are located in reliable and fast network infrastructure high communication time results most likely from a high number of RPCs. Each RPC takes at least half a millisecond overhead for the network to transfer the request, the COO Service to schedule the request to an available worker thread and to transfer the result back to the Web Service. So a high number of RPC requests directly lead to bad performance without having a bottleneck in any single application tier.
In the details section an RPC statistic based on RPC type is being provided indicating how the different RPC types contribute to the total RPC time and count.
The most common problem in this area is the so called Typewriter, which can be determined by a high “Request Count” in the “COOSTAttrSel” RPC, which is the RPC requesting object information from the COO Service. The typical source for that situation is a loop iterating over a list of objects without previously loading the required attributes of all these objects in a single call. So any access to an object will require the Kernel to load the object one by one. While this will produce the correct result, it will lead to multiple RPC requests and therefore to bad performance. To optimize the Typewriter scenario requires a call to coort.LoadAllAttributes/LoadSpecificAttributes providing the list of all objects being iterated.
The list of the “Top 10 events” issuing RPCs” may help you identifying the method containing the loop. This can be identified by the last Event before the count drops to a low value. Clicking on the Event will lead you to the detail view showing the instrumentation points recorded while processing this method.
Improve Object Attribute Reads
This rule analysis how many object attributes are read and how much time is consumed to do this. The instrumentation points required for this analysis are only recorded in Debug mode. In less detailed recording levels this rule will show up as “N/A”.
As the GetAttribute variants are the usual way to access Fabasoft Folio objects, it is not an error to do so, but if accessing information takes a reasonable fraction of the processing time, it is still a good starting point for further investigations. So use the list of “Top events accessing object attributes” to identify the method, in the context of which many attributes are being accessed.
You may optimize data access either by caching or by calling GetAttribute once instead of iterating an attribute using GetAttributeValue. Also a call to HasAttributeValue with a subsequent call to GetAttributeValue can often be replaced by a single GetAttributeValue saving at least the overhead of an access check.
When looking at the “Attribute Access Statistics” you can determine the duration for a specific type of data access. Most interesting here is the fraction between the “Duration” and the “Self Time” where a high “Self Time” indicates, that the duration mainly results from the count of data accesses, whereas a low “Self Time” compared to the duration indicates cache misses either on the object itself or on objects required for the access check. Cache misses will result in RPCs fetching object data from the COO Service.
Click on the Call name to go to the “Selected Statistics Events” tab, sort by duration and try to solve the performance problem, when attribute accesses lead to COO Service requests.
Optimize HTTP Requests
The Fabasoft Client communicates with the Fabasoft Web services using http requests. Each call requires at least one network roundtrip and the allocation of a web service thread. Issuing too many calls will result in a delay mainly caused by the network latency.
The “Optimize HTTP Request” rule helps you determining why a request on the Fabasoft Web Browser Client is slow.
- The number of HTTP requests should be low. Each http request requires a network roundtrip which can be very expensive when the device is connected via mobile data connections.
- In addition browsers limit the number of concurrent connections to a server so otherwise parallel requests will be serialized limiting the number of parallel requests.
- The “Client Request Time” indicates the time required to send the request until the response has been fully received by the browser. The “Client Processing Time” represents the time needed to process the result and to make the required changes to the page being displayed. A large “Client Processing Time” indicates a high rate of changes to the DOM model of the page, which is most likely the result of large lists being rendered. Older browsers (e.g. Internet Explorer 7 or 8) have significantly slower engines which results in higher “Client Processing Time”.
- The “Network Time” is calculated from the difference between the “Client Request Time” and the “Server Processing Time” and depends mainly on the connection speed, connection latency and the amount of data being transferred. The size is being indicated here by the “Request Size” and “Response Size”.
Based on that analysis you can focus on the part of the request, which has most influence on the request time.
Optimize Database Statements
Fabasoft COO-Services read and write object data from/to a relational database. Reading data is required in case of queries and when objects are currently not in the COO-Service cache. Writing data occurs every time objects are being created, changed or deleted. Object lock information is also persisted on the database.
The way how to optimize queries depends on the type of database statement:
Reading Objects (COOSTAttrSel):
- Reading objects only occurs when objects are not in the COO-Service cache. So try to keep all active objects in the COO Service cache.
- Minimize the working set of objects being accessed by the user.
- Preload objects together before iterating a list of objects to reduce the count of database queries.
Queries (COOSTQuery): Processing queries is executed in several phases:
- Query for the object ids matching the properties given.
- Load all properties of all matching objects which are not in cache.
- With this information the kernel applies the security model and filters out those objects that may not be found by the user.
How to Configure Certificate Authentication on Linux
The default authentication method for Fabasoft app.telemetry web browser client users is "Basic Authentication". Since 2011 Winter Release you may use https with client certificates as an alternative login method. The following guide explains how to configure “Certificate Authentication” for Fabasoft app.telemetry using an Apache webserver on a Linux system.
Prerequisites:
- Server Certificate (pem and key file)
- CA certificate(s) of the client certificates
Configuration:
- Install mod_ssl (mod_ssl-<version>.<os>.<arch>.rpm)
- Copy the server certificate (e.g. to /etc/pki/tls/certs/)
- Copy the server certificate key file (e.g. to /etc/pki/tls/private/)
- Use chmod/chown to provide access to the certificate files to the apache user
- Configure Apache SSL and access restrictions (e.g. /etc/httpd/conf.d/ssl.conf)
- Set the "ServerName" to the name used in the server certificate
- Set the "SSLCertificateFile" to /etc/pki/tls/certs/<your certificate>.pem
- Set the "SSLCertificateKeyFile" to /etc/pki/tls/private/<your certificate>.key
- Set the "SSLVerifyClient" to require
- Set the "SSLVerifyDepth" to a value of your chioce (e.g. 10)
- Add the SSLOptions +StdEnvVars
- Import the client CA certificate
- openssl x509 -in cacert.cer -text >> /etc/pki/tls/certs/ca-bundle.crt
- Add the common names (cn) of the users to the groups provided in /etc/app.telemetry/htgroup
- Restart the Apache web server (you have to provide the passphrase for the server certificate key file when restarting the web service).
Details / Hints:
- To extract the pem/key files from a pkcs12 certificate you may use the following commands:
- openssl pkcs12 -clcerts -nokeys -in vmcentos.pfx -out server.pem
- openssl pkcs12 -nocerts -in vmcentos.pfx -out server.key
Use Case Analysis
Implementation:
The object context required by the use case analysis has to be provided by implementing a wrapper to the GetObjectContext method. This method is called several times per request on the object a view or use case is operated upon. The wrapper should set the return parameters ctxobj, ctxtype, context and category, where ctxobj is the „container“ object (e.g. teamroom or file) of the current object, ctxtype is the class or type information (e.g. objectclass or file plan entry). The context is a string representing hierarchical context information (e.g. the file plan hierarchy, the syntax is currently unspecified and unparsed). The category should be set to the main document category.
Prerequisites:
- Fabasoft Folio/eGov Suite Version 21.1.0 or later (fscvapp)
- Implementation of a postwrapper for FSCVAPP@1.1001:GetObjectContext
- Fabasoft Cloud Teamroom Implementation in 21.1.0
- Fabasoft eGov-Suite Implementation to be done
- Fabasoft app.telemetry Server 21.1.
Configuration:
- Use Extended Log Definition (UseCase)
System View
Fabasoft app.telemetry System View collects data that lasts 30 minutes and can be viewed in four separate views, namely the Overview, Instance, Details and Service Connections view.
- The Overview view accumulates all instances of a service, groups them per label and shows the connections between the services.
- The Instance view displays the data of the different instances of the opened service in a table.
- The Details view visualizes the connections of the selected instance with a selectable connection depth up to 4.
- The Service Connections view shows the connections of a service with a selectable connection depth up to 4.
From the Overview view, the Instance view and Service Connections view are reachable through the context menu. The Instance view is also reachable from the Service Connections view context menu. The Details view is only reachable through the Instance view.
For extra information, it is possible to hover over the elements in the Overview, Details and Service Connections view.
Overview
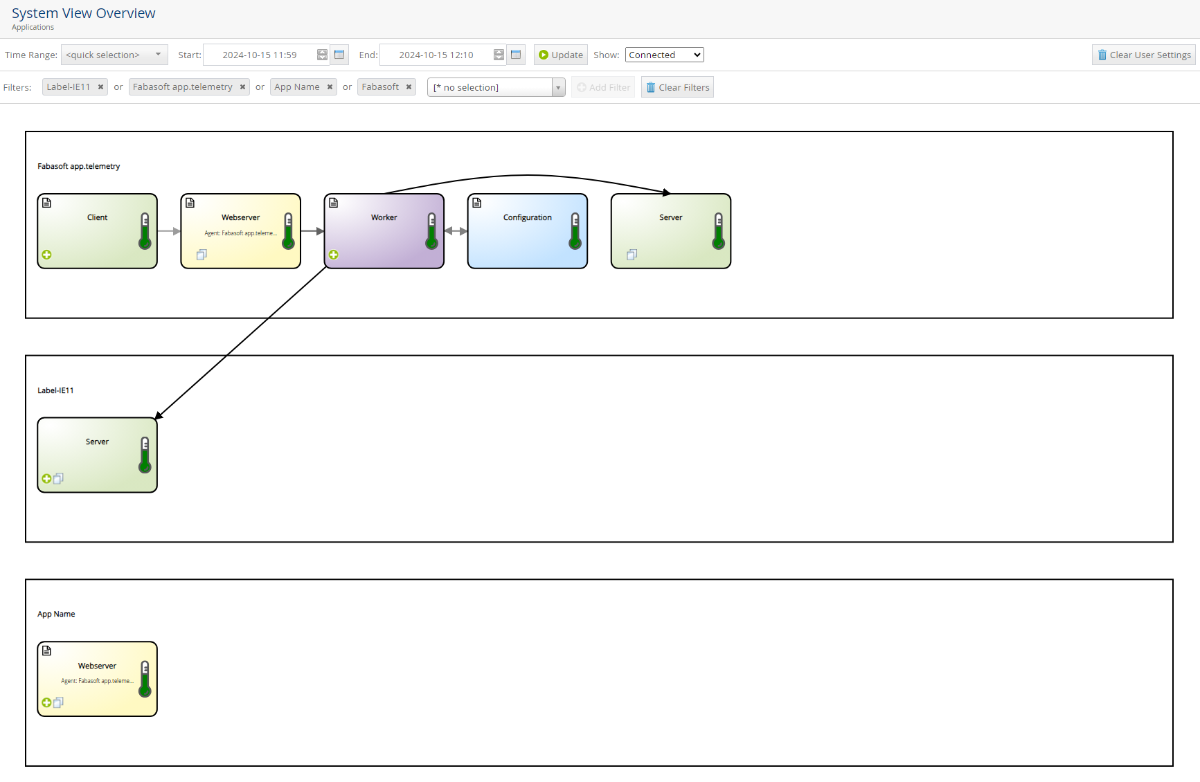 The above screenshot shows the Overview view. At the top we see two toolbars:
- The first toolbar allows for choosing the time range (standard: last 5 minutes), start the request with the update button and clear the settings done by the user. The dropdown menu (Show:) becomes only visible when data is displayed and allows to show all services that have no connections.
- The second toolbar is for filtering the groups. When opening the dropdown menu, all possible groups that currently exist are provided as a suggestion. But it is possible to add a customized filter (for example: “Fabasoft”) by typing it in and selecting it from the suggestions.
In the screenshot, three different groups are visible: “App Name", “Fabasoft app.telemetry” and “Label-IE11”. The group names are taken from the configured labels (in configuration). If the service has the document icon in the upper left corner, then a log pool exists for that service (and can be opened in a new window by clicking that symbol). If the log pool is under a label in application, then the service is displayed in that group. If a log pool exists but it is not added to a label, it will be grouped into a “No Label” group. For services without a log pool, it will be tried to group it as best as possible. But when the grouping is not possible, a group with the name as a group name will be generated.
The initial layout can be changed. A service can be moved (through dragging) in the same group to a different position or between groups. Services that have not been moved will position themselves accordingly in the group. When the shift key is pressed during dragging, a service can be copied into another group where it takes over all connections inside that group (example: “Server” in the screenshot). For a cleaner view, connections inside groups will be shown while the connections between groups are hidden. When a service has hidden connections, a “+”-icon is shown. A click on that icon will display all hidden connections of that service or if all are displayed, hide them again. If a service is moved into a group where a copy of it already exists, the services will be merged together. This means, that in a single group, a service can exist only once and as such cannot be copied from the same group into the same group (it will be moved instead). The “Webserver” service in the screenshot is also copied into two groups but that is because of the configuration. It is possible to assign multiple labels to a log pool, so the log pool will appear in multiple group as if a user copied the service manually. For the user to identify which service has a copy, an icon on the lower left corner is displayed.
Important: When a user moves or copies the service, the user settings will eliminate the default settings. This means that if a service is per default in multiple groups, only the group or groups that the user moved to or copied from and to will have that service.
Extra Information to the services and connections is displayed when hovering over them. The connections color varies depending on its count. The darker, the higher the count, where the highest count is the darkest color.
The context menu specific for a service can be opened when right clicking on the service. Then, the options to switch to a different view are displayed, as well as actions like opening the log pool of the service, if one exists.
Instance View
The following screenshot shows the default structure of the second view. 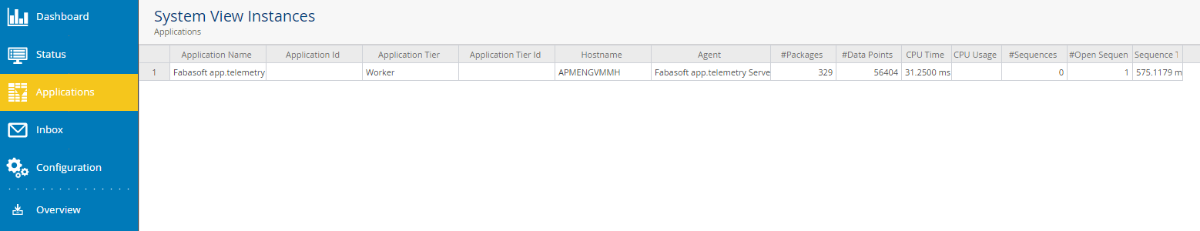
The accumulated information of the service is split into the specific instances. When right clicking an instance row, the context menu is opened, allowing to open the Details view.
On the left, a new Button Overview is displayed, allowing to move back to the Overview view.
Details View
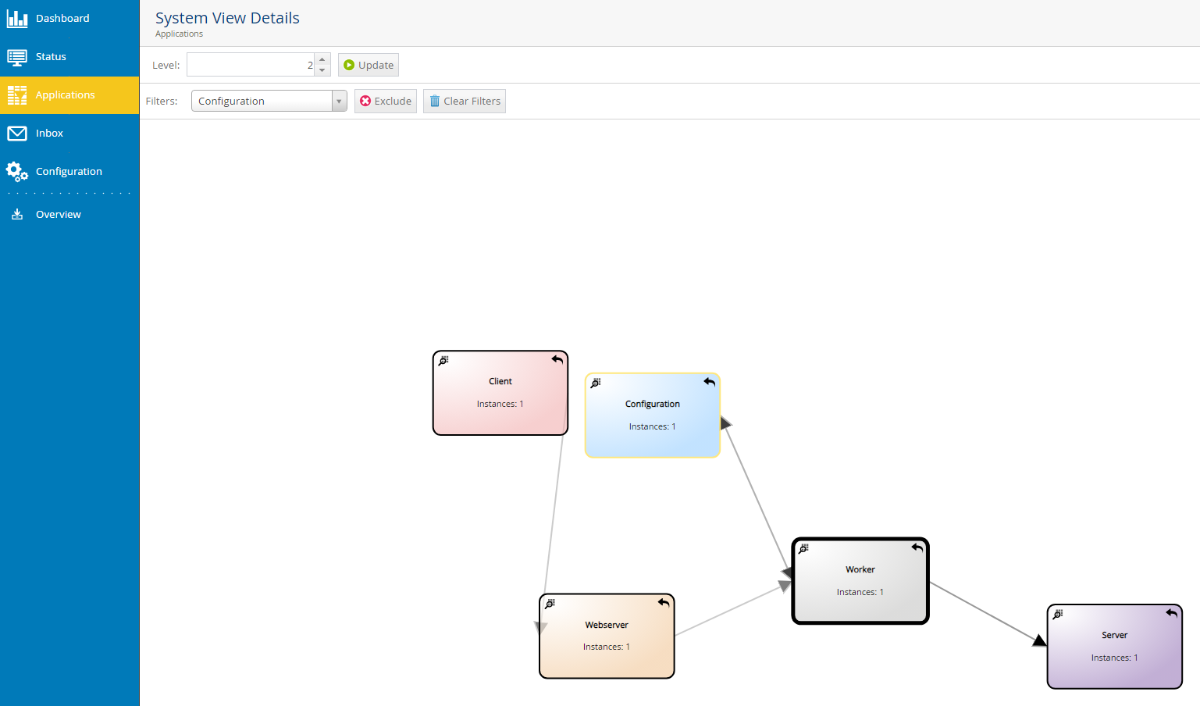 The Details view has two toolbars:
- The first toolbar allows to change the level of depth that is shown. For example: if in the screenshot the level of depth would be 1 instead of 2, the “Server” and “Service Analyzer” instances would not be shown.
The Update-Button requests the data again and resets the position on the screen. - The second toolbar is a filter that allows to exclude instances of services, except the current one.
The current root instance is the instance with the big black frame. Each instance has two icons, on the left a loop icon that opens the service view with the current time range in a separate window. On the right side a back icon that leads you back into the second view with the instances of the clicked instance. The yellow frame is shown when an instance is selected. It changes the filter to the service name to make it easier to exclude (except the root element).
The instances can be dragged freely around but try to group together in the middle of the window. The connection between the instances has larger arrows the higher the value of the connection.
When double clicking on an instance (except the root instance), the clicked instance becomes the new root.
Through the context menu, another instance with a count of 1 (except the root instance) can be set as root. When the count is larger, multiple instances are accumulated and it cannot be decided which instance should be chosen as root. But it is possible to set it as root through going into the Instance view for that service.
The Overview button on the left leads back to the Overview view.
Service Connections View
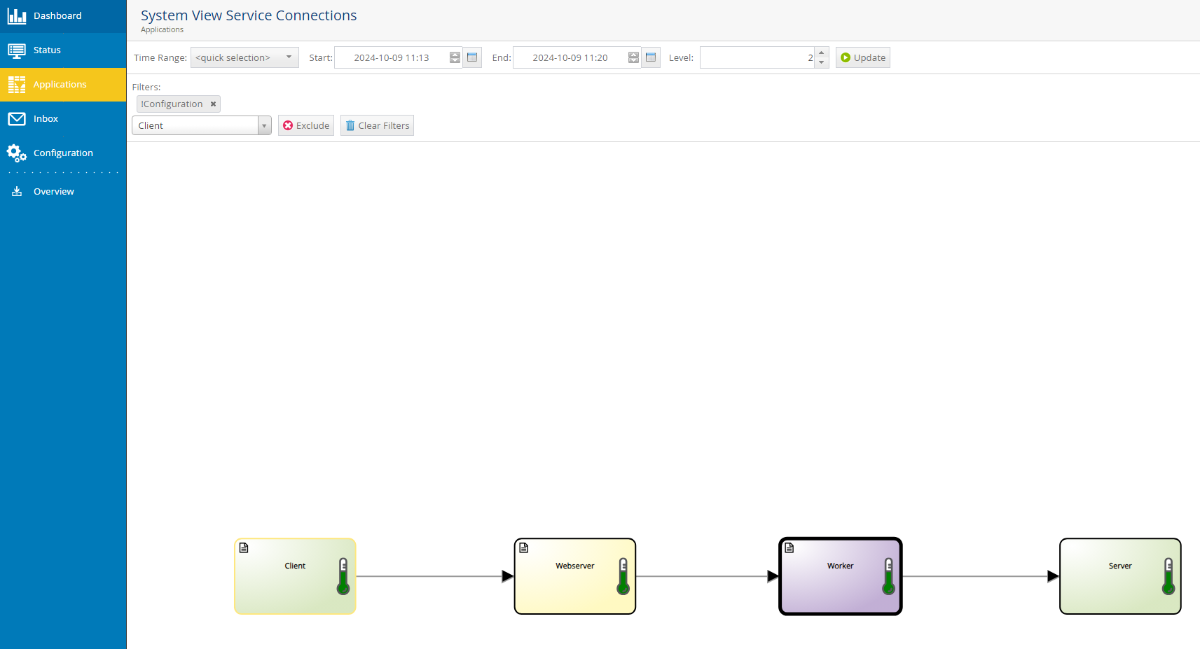
The screenshot above shows the Service Connections view. The first toolbar is a combination of the toolbar from the Overview view and the Details view. It has the timeframe selection from the Overview view and the connection level selection from the Details view. The second toolbar allows to exclude services similar to the Details view (here, the Configuration service, as well as all services only connected through it, are already excluded).
The display of the connected services up to a maximum depth of 4 from the root is similar to the services in the Overview view.
The context menu allows to set the root to a different service and open the log pool view and the Instance view.
The selection of services also preselects the filter for exclusion and the Overview button on the left sidebar also exists.
Database Schema User Permissions
PostgreSQL
Since the change of access permissions for the default schema “public” in PostgreSQL, the user needs to be granted rights for its usage:
- GRANT usage ON SCHEMA <schema> TO <user>;
The user also needs the create permission on the database to be able to create another schema:
- GRANT create ON DATABASE <database> TO <user>;
Microsoft SQL Server
To be able to create schemas, the CREATE SCHEMA permission for the database is needed.
- USE <database>; GRANT create schema TO <user>; GO
For using already existing schemas, the required permissions need to be granted:
- GRANT <Schema permission> ON SCHEMA :: <schema> TO <user>;
- Example Schema Permissions:
- Select
- Insert
- Update
- Delete
- …
- Example Schema Permissions:
With the Microsoft SQL Management Studio, the user or one of the user roles needs to be added to the security->user of the database. Then the user or the role needs to be granted the permission in the properties of the database.