

Release Notes
Fabasoft app.telemetry 2025
System View in Applications
The System View shows the interaction between services. To achieve this, four views(Overview, Instances, Details, Service Connections) were created. The Overview is the landing page where the services and their interactions are visualized and sorted into groups. The context menu for the specific services (right click on the service) allows to switch to the Service Connections view and the Instances view, as well as opening the logpool if the service has one. The Details view is only reachable through the Instance view because it shows the connections for only a single instance of a service.
In addition, you can filter in the Overview which groups shall be shown and in the Details view and Service Connections view which services, as well as all connections that only go through them, shall be excluded.
Rename Software-Telemetry for live data to Telemetry-Live
For better understanding when analyzing requests, the Software-Telemetry was renamed to Telemetry-Live where current data in the ram can be viewed.
Allow setting schema for databases
The database connections in configuration have now an extra input field where the schema of the database can be set. If no schema is set, then the default schema will be automatically taken.
Important: The database user needs the rights to create new schemas in the connected database, as well the right to use them. For the default schema the correct permissions are needed.
Solution filter in Telemetry-Research View and Request Details
In the Telemetry-Research View, you can search for requests that contain objects of a specific Fabasoft PROCECO Solution. To use this solution filter, the property "solution" has to be set in Log Pool configuration to the COO address used as default solution for this Log Pool. Then you can select the Solution you want to filter for from the "Solution" drop down menu in the Telemetry-Research View and start the search.
In addition you can filter in the Request Details for events corresponding to objects of a specific Solution by selecting the Solution in the drop down menu in the "Details" tab.
Search query in Telemetry-Research View and Request Details
The full-text search field in the Telemetry-Research view and in the Request Details has been extended: You can now enter a SQL like query in the search field to search for arbitrary combinations of event parameters and other event information such as event name, module, etc. To enter your query, click on the button next to the search field.
Screenshot reminder in feedback dialog
You now have the customization option to add a screenshot reminder to your feedback dialog. If this option is set, an additional dialog will be opened when the user didn't attach a screenshot and clicked to send their feedback. It is pointed out to the user that no screenshot was attached and they are asked if they are sure to send their feedback without screenshot. In the reminder dialog they can choose to either go back to the feedback dialog to check the option to attach a screenshot or to send their feedback without screenshot.
Calculated Log Pool Columns
Log Pool columns can now be calculated based on formulas combining any of the existing columns. The SQL like syntax used in other places is reused here. E.g. use this feature to calculate the processing time as the request duration minus read time minus write time.
CPU Time Log Pool Column
Within the telemetry data CPU usage is recorded in the Session Info events consisting of absolute CPU usage per thread from the start of the thread until the particular event occurred. Depending on the operating system the resolution of this time information is more or less accurate (e.g. ~16ms on Microsoft Windows). The CPU Time column will calculate the total CPU consumption of that request on the particular process including all threads directly dependent within that application. The CPU time column combines kernel time and user time to one single value, which should indicate that a request is mainly CPU bound if the CPU time value is in the range of the total request duration. Due to the limited resolution or the potential parallel execution of threads, the CPU time may be larger than the request time. The CPU time column is always 0 on some platforms (e.g. Browser, Java-Native), because there are no CPU time values available within the telemetry data.
Fabasoft app.telemetry 2024
Platform Support for Red Hat Enterprise Linux 9
All Fabasoft app.telemetry Services are supported also on Red Hat Enterprise Linux 9.
Reloading time ranges for large requests
Large requests may not be fully loaded when their number of telemetry events exceeds the configurable limit. The parts of the request which couldn't be loaded are now shown with a gray background in the request overview and you are able to reload specific time ranges within the request. To do this, you zoom into the time range you want to reload and click on the "Reload Time Range" button.
If loading the request is exceeding a specific time limit, only the part of the request which has been loaded until then is shown. In this case a button "Continue Loading" appears in the request overview, on which you can click to continue loading the whole request.
Explicit passing of thread context in the C/C++ SDK
In cases where you don't want the current thread context to be used, but explicitly define the current software telemetry context for your application, you can use now the transaction handling functions available when defining APM_EXPLICIT_TRANSACTION in a preprocessor directive.
You use the transaction handle returned by APMTxCreateContext or APMTxAttachContext to pass to other explicit transaction functions such as APMTxEvent or APMTxReleaseContext.
Quick filter for specific columns
If you set the "quickfilter" flag for a string column in the Log Definition, there is an additional filter option in the Software-Telemetry and Telemetry-Research view to enable you to directly filter for this column by setting the filtered value in the corresponding field.
Request Views for analyzing Fabasoft Folio requests
To help you analyze Fabasoft Folio requests, there are now four new views in the Request Details showing specific information:
- In the "VAPP" tab you find a tree structure corresponding to events related to the Virtual Application module as well as the expressions executed from within your specific component.
- In the "VAPP Flame Graph" tab also the events related to the Virtual Application module and expressions are shown, visualized as a flame graph.
- In the "Expressions" tab you get an overview of the executed expressions called per component and file.
- In the "Method Calls" tab you get an overview of the executed method calls per action and object class.
Set root event
You can now set an event with flag "Enter" as root event by clicking on the "Set Root" button in the call stack in the Request Details. This event is then selected as new root element instead of the very first event of the request.
As a result, the call stack only consists of events executed within the call stack of the root element and also statistics, errors, expressions and method calls are shown only for telemetry data included in the root element call stack. You can reset the root event by clicking on the "Unset Root" button in the toolbar of the Request Details.
Fabasoft app.telemetry 2023 UR1
Hostname in Activity Statistics Agent Dimension
To account for cloud native applications deployed in a cluster, the application hostname corresponding to the pod name in Kubernetes is used as "Agent" Dimension in the Activity Statistics instead of the app.telemetry agent, in order to be able to differentiate between different pods that are all connected to the same agent.
ImageProxy deactivated by default
The softwaretelemetryweb module provides the ImageProxy feature, which allows a web client to download images from other websites through the server. This is required to render screenshots using JavaScript, when images are loaded from websites other than the current web pages host, because the client will decline such requests. This server feature opens a backdoor called Server Side Request Forgery (see https://owasp.org/www-community/attacks/Server_Side_Request_Forgery: new window). Although there are some filters implemented, that restrict the usable URLs, the feature opens a channel for SSRF attacks. Therefore, the ImageProxy is now deactivated by default and if enabled the URLs can be restricted using a configurable regular expression.
Extended SessionInfo
The SessionInfo contains now also the number of involuntary context switches and major page faults besides user time, kernel time and process memory on Linux systems. The difference of these counters with respect to the last SessionInfo is printed out next to the absolute value. In addition, the SessionInfo is printed out at least every one second, to ensure having system information also in the case when no telemetry events are occurring.
Session duration
When you start a session for an application in the “Start Software-Telemetry Session” dialog window, you can now specify a duration, after which your session is automatically stopped. The duration of a session can be maximum one hour.
Service View
The Service View is a new view in the Fabasoft app.telemetry Client which allows a service-oriented perspective on telemetry data instead of the request-oriented perspective in the Telemetry Data or Research view. When you are analyzing a request, you can find out what happened in parallel on the service during the time the request was executed, i.e. which other requests were processed at the same time as the request you are interested in.
To open the Service View from within a Log Pool, first select a request and then click on the "Open Service View" button found at the bottom of the "Details" tab. This will open a new window with the Service View, where all requests are loaded that were processed at the same time as the request you selected. The requests are loaded for the service which was currently selected in the "Details" tab, if you select one specific telemetry event, then the time of this event will get drawn as a red line in the Service View to help find parallel events that happened at a specific point of time.
The loaded requests that were processed by the service during the selected time period are shown in the top area of the Service View, where for each thread of the service individual blocks are drawn which correspond to blocks of telemetry data sent by the service. A request can consist of a single block or also of several blocks depending on the duration of the request, the transmitted data size and if the request was processed by several threads. The color of a block indicates the module with the highest selftime within this request section.
The blocks marked with light gray correspond to the request you selected in the Log Pool. If you click on a block, also all other blocks belonging to the same request are highlighted, and the request details are shown in the bottom area of the Service View, analogously to the Telemetry Data or Research view. You can also select several requests at once by holding the Ctrl key and clicking on the respective blocks, then the requests are shown next to each other in the "Overview" tab.
Another possibility to open the Service View is from the "Applications" Tab of a selected request, where clicking on the "Open Service View" button will load all requests processed on the selected application for the time of the selected request.
You can also persist the loaded telemetry data for a service by clicking on the "Persist" button in the Service View. This saves the data in a "Service View session" file, analogously to the Software-Telemetry sessions, which you can upload and analyze later by selecting it from the "Service View Session Files" widget in the "Applications" view.
Reloading ranges of large requests
When the number of events within a request is exceeding the configured limit, it can't be fully loaded and therefore only a limited number of events could be analyzed until now. You now have the possibility to reload specific time ranges within such a large, not completely loaded request by zooming into the range you want to load in the request overview and then clicking on the "Reload Time Range" button. Then the parts of the request that are not within the specified time range are unloaded again in favor of the parts within the specified range to be loaded. This enables you to at least analyze specific points of interest within large requests even if the request as a whole can't be analyzed. This works analogously for the Service View.
Fabasoft app.telemetry 2023
.NET 6 Software Telemetry library
For .NET 6 a native implementation of the Software Telemetry .NET API is now available as "softwaretelemetry" NuGet package, which also supports Software Telemetry Counter. To use the native library, set the environment variable APM_DOTNET_TRANSPORT.
Improvements of SNMP Counter
Enumerated integer values returned by a SNMP Counter are now mapped to their respective label. In addition, also values returning an IP address can now be evaluated and SNMP indices are read from the MIB to map the available instances correctly.
Open Research View from Associated Requests
If you analyze a specific request and e.g. you want to find out what the specific user additionally did at this point of time, you now can go directly from the Associated Requests of that request to the Research View by clicking on the "Open Research" button. Two minutes before and after the start time of the request is then used as filtered time range for the Research View. The value of a column of an Associated Request can also be set as filter for the Research View by a right-click on the value and selecting "Open Research View Filtered".
cURL SMTP Notification Channel for Microsoft Windows
Sending mails using the curl library is now also supported on Microsoft Windows in addition to Linux.
Change column length in database table
If the column length of a column defined in the Log Definition is increased for an already defined Log Pool, the respective column is also altered automatically in the database table to prevent errors when writing values to the database.
Fabasoft app.telemetry 2022 UR1
Export all Requests from Research View
To allow the export of many requests (up to 10000) within one zip file, it is now possible to export the result of a query in the research view. Click "Download" and select "All Requests" in the download dialog. It may take several minutes to export the data, so keep the request count low by adjusting the time range and the filter criteria. Make sure to clean up the downloaded session from the software-telemetry session files list in order to free the disk memory on the server.
Secure TCP Transport between Agent and Library
TCP Transport between the Fabasoft app.telemetry Agent and the Library is secured by using TLS both for the Software-Telemetry C/C++ and the Java library. To secure communication, you have to set the configuration parameter "TelemetryTLSPort" in the agent configuration (10008 by default) and also configure this port on the library side correspondingly by setting the environment variable APM_TRANSPORT=tls://<agent hostname>:<port>. You can still have the agent listen in parallel on the unsecure port (10002 by default) to receive telemetry data from libraries of older versions.
Support SNMPv3 with User Based Security
SNMP Version 1 and 2c, supported by app.telemetry over many years, use unencrypted UDP packets to query data from servers or network nodes. SNMPv3 supports authentication and encryption of SNMP traffic.
Force Service Checks on Service Group
Until now only single Service Checks could be forced via right-click and selecting "Force Service Check". This is now possible also for a Service Groupe, where you then force all Service Checks belonging to this group at once.
Research for Requests running at a defined point in time
To be able to track long running requests, which are running at a defined point in time, you go to the Research View, enter the specific time as end time of the search interval, select a suitable start date and click the new “Running” checkbox. The query will show you all requests from the selected interval which were running at the beginning of the second specified as end time.
Open Subrequests in a new Window from Detail View
While analyzing subrequests originated from an application which has the “Don't Resolve Subrequests” setting selected in the according Log Pool. By clicking on the new link in the Parameter column of the GetContext event, the request will open in a new browser window. These links are not available from sessions.
Fabasoft app.telemetry 2022
Platform Support for Microsoft Windows Server 2022
All Fabasoft app.telemetry Services are supported also on Microsoft Windows Server 2022.
Open request in separate browser window
To analyze specific requests in detail, you can open the “Request Details” view visible at the bottom in the Software-Telemetry and Software-Telemetry Research View in an own browser window. A new window is opened by selecting a request and clicking on “Open in New Window” in the left sidebar. Alternatively, you can copy the link referencing to the selected request by choosing “Copy Link” in the context menu of a request. This link can then be sent to other users, so that they can directly open the corresponding request for analysis.
You can copy the link also within the “Details” tab in the “Request Details” view, to refer directly to the currently visible node within the request, or in the “Associated Requests” tab to obtain the direct link to an associated request. The corresponding symbol is located in both cases at the bottom bar.
Stop resolving subrequests
If you don’t want to load full requests including all associated subrequests for a Log Pool, you can set the property “Don’t Resolve Subrequests” in the Log Pool configuration, which can alternatively be set in the corresponding Log Definition as “dontResolveSubrequests” flag in the root “APMLogAnalyzer” element.
When this property is set, request contexts are only resolved down to the level of the corresponding application of this Log Pool. Associated subrequests are still shown in the “Associated Requests” tab in the Request Details pane. They can be loaded in full detail by selecting the corresponding subrequest and clicking on “Copy Link”, then this specific subrequest can be opened in a new window.
Application properties filter for Log Pools
You can add an additional application filter in the Log Pool configuration to filter for application properties that have been registered in the instrumentation of your application or have been set as environment variables with the prefix “APM_PROPERTY_” in your system. The filter is entered in the form of an SQL like query and can be used to configure separate Log Pools for applications with the same registration but differing in other properties, e.g. to distinguish between different systems (production and test system) with their applications otherwise identical.
Screenshots as attachment in feedback notification
If you want to have the screenshot of a feedback sent as attachment in the notification mail, you may check the “Add Feedback Session Attachment” property in the configuration of your SMTP Notification Account.
Software Telemetry Counter Charts
Counters defined via Software Telemetry can now be directly shown in your dashboard using the “Software Telemetry Counter” data source type when creating a new chart. To specify the counters for the chart, a SQL like query string is entered to filter for specific counter attributes.
Hide columns in the Log Definition
To hide specific columns in Log Pools, Filtered Log Pools or Log Pool Views, set the displaypriority for the relevant column in the Log Definition to -1. This also applies for system columns such as “Agent”, if you want to hide internal hostnames from users having access to that Log Pool.
Fabasoft app.telemetry 2021 UR 1
Full-text search in Research view
If you are looking for a particular text in the telemetry points within a particular time interval, you can use the new full-text search field in the Research view to identify all the requests containing this specific search string.
Anonymization of personal data
Specific columns containing personal data (e.g. Loginname, user group) can be automatically anonymized by setting a corresponding “anonymous” flag in the Log Definition. Additionally, the Data Anonymization has to be activated in the Log Pool Properties, where also the number of days is set after which data is anonymized.
The entries for a column to be anonymized are encoded using a random GUID which changes every day. This GUID is written to the database instead of the real entry and the information which is used to decode the GUID into the real value again is stored only for the number of days specified for the anonymization. Therefore, for personal data older than the specified number of days only the GUID can be read, enabling to still distinguish between e.g. different users, but not showing the directly related personal information any more. For younger data the real values as described in the Log Definition are shown enabling you to still read the personal data directly for this specific time period.
If the anonymization is activated for an already existing Log Pool without former anonymization, older data won’t be anonymized and new data arriving after the activation will be stored in a new table with the corresponding anonymization. Personal data contained in the raw data files, in sessions or feedback dialogs is not anonymized.
The anonymized data encoded by the GUID is also considered for the statistics accordingly.
In addition to the anonymization of columns containing personal data, such columns can be hidden altogether from specific users or groups by entering such users and groups in the Log Pool Properties next to “Hide Personal Data from User/Group”.
Support of multiple telemetry services in C/C++ Client Applications
Applications like Fabasoft Native Client process data in the context of multiple services each using their own app.telemetry server. The correct assignment of telemetry data to the right app.telemetry server is now supported by using a common directory per service. Initialize and close your service directories as required and associate your registered applications with the directory context, so that you can send each applications telemetry data to the correct telemetry server also in case of later data recovery processing.
Automatic configuration of service checks for telemetry counter
When registering a telemetry counter, you can automatically configure a corresponding service check for this counter by specifying at least one of two new attributes in the registration:
- APM_COUNTER_ATTRIBUTE_WARNING_LIMIT: Warning limit for the service check.
- APM_COUNTER_ATTRIBUTE_ERROR_LIMIT: Error limit for the service check.
Namespace property within Kubernetes
A Kubernetes namespace provides the scope for Pods, Services and Deployments in a Cluster. The namespace is thus an important information where a specific container belongs to. As Fabasoft app.telemetry should know where services belong to, the Fabasoft app.telemetry library attaches this namespace information to the application registration as an application property (apm:namespace). There is currently no documented source available, where the namespace can be read from, but if there is a file named /run/secrets/kubernetes.io/serviceaccount/namespace it contains the namespace and the library reads that file. If the file is not available, the Kubernetes Downward API should be used to provide an environment variable named “APM_NAMESPACE” containing the namespace of the pod. The Fabasoft app.telemetry Library will pass the value to the apm:namespace application property.
Fabasoft app.telemetry 2021
Platform Support for RHEL/CentOS 8
All Fabasoft app.telemetry Services are supported also on RHEL/CentOS 8.
OpenMetrics
The Fabasoft app.telemetry Agent can provide an http endpoint for retrieving Software-Telemetry Based Counters of all connected applications in the OpenMetrics (Draft) format, which is supported e.g. by Prometheus. Enable this feature by providing apptelemetryagent command line options openMetricsBindAddress and openMetricsBindPort.
“gap” column in Software-Telemetry Details
The new “gap” column denotes the time between the previous and the current telemetry event, which helps in finding delays in not instrumented parts of the code.
Fabasoft app.telemetry 2020
Database cleanup using Partitioned Tables for PostgreSQL
Automatic cleanup of Log Pool tables and statistics is supported on a daily basis. Since deleting records is at least as costly as the insertion of new records, the Fabasoft app.telemetry 2020 supports the automatic usage of partitioned tables in PostgreSQL (as implemented since PostgreSQL 11). Therefore, every day a new partition table will be created to hold the records of that particular day. Cleanup is performed by simply dropping outdated partitions. There is no migration of old table layout performed, so switching from a non-partitioned table layout to a partitioned table layout requires manual migration of data if necessary. An app.telemetry database connection can either use partitioning for all tables or store all the data in the traditional table layout. But you can create an additional database connection to migrate the log pools by changing the database connection assigned and optionally migrating data.
Linux counters from the /sys filesystem
Linux systems provide status data and performance measures in files under the /sys folder. There are a number of such counters that are not accessible using SNMP, so Fabasoft app.telemetry agents can now access the files in the /sys folder to read the respective counters.
Additional Functions Available in Calculated Counters
Additional functions are available calculation counter values:
- log … Natural Logarithm
- log10 .. Logarithm base 10
- sqrt … Square root
Grafana Support for Software-Telemetry Based Counters
Grafana is a common visualization tool used heavily in container environments. Fabasoft app.telemetry now supports JSON REST queries, that reflect the Software-Telemetry counters in a format compatible with Prometheus data sources. So you can integrate Fabasoft app.telemetry Software-Telemetry counters in your Grafana dashboards. See the REST-API documentation on the product kit for more details.
Support of Dimension Filters in Activity Statistics
The Sunburst visualization of the Activity Statistics data operated on the unfiltered statistics data regardless of the filters set in the Stream, Time Line or Data Grid view. Now, filters are respected and can even be extended based on the selection within the Sunburst graph. In the Stream and Time Line visualization an additional Dimension “Agent” is supported.
Container Support
The Fabasoft app.telemetry rpms now support installation within RHEL/CentOS 7 containers. So a Fabasoft app.telemetry server can now be hosted in a container environment e.g. on a RedHat OpenShift Container Platform.
To improve application identification in a container environment, an application is now identified by a random GUID instead of Agent Id and Process Id, which is not unique in a container environment, where the main process of each container is started with pid 1. This change requires the extension of the block header format of the software telemetry data, which makes the data incompatible with older versions of Fabasoft app.telemetry. Therefore, an older Fabasoft app.telemetry Server cannot read requests exported from a version 2020 server. And during the upgrade process, an older Fabasoft app.telemetry Server will not be able to process telemetry data received from already upgraded Fabasoft app.telemetry Agents version 2020. So the preferred upgrade sequence implies to upgrade the Fabasoft app.telemetry Server before the agents.
Fabasoft app.telemetry 2019
Software-Telemetry Based Counter API
The addition of a counter API based on the Fabasoft app.telemetry Software-Telemetry data transport enables applications to provide insight into their operation with minimal configuration. The Software-Telemetry based counter API also sidesteps limitations of Windows Performance Counters and SNMP by allowing for much greater flexibility to identify counter instances. Check the SDK-Documentation for more information.
Fabasoft app.telemetry 2018 UR 3
Extended Application Registration Properties
Applications can register additional metadata about them that empowers operators to gain a better understanding of which specific services were involved in requests. A small set of predefined metadata is automatically provided by the Software-Telemetry API libraries, check the SDK Documentation for more information.
Fabasoft app.telemetry 2018 UR 2
Fabasoft app.telemetry Configuration service
The new Fabasoft app.telemetry Configuration service manages app.telemetry configuration data such as:
- The Fabasoft app.telemetry Infrastructure configuration (infra.xml, encryption.key and encryption.pem)
- User settings
- The License
- Request Categories
- …
The files that represent the listed configuration data changed their location, which may require changes to the configuration of backup software to ensure backups remain usable in the future. A running Fabasoft app.telemetry Configuration Service is very important for the correct operation of all Fabasoft app.telemetry services.
Loading of XML and JSON files from Infrastructure Scripts
The Fabasoft app.telemetry infrastructure scripting gained functions to load and parse Log-Definitions (including forms), and JSON files into JavaScript objects that are directly useable.
Dynamic Java Instrumentation (JVMTI) removed
Dynamic instrumentation of Java Applications using JVMTI has been removed.
Authentication support for mod_auth_openidc / Keycloak
Authentication using the Apache HTTPD module mod_auth_openidc with Keycloak is now supported. With appropriate configuration the Fabasoft app.telemetry Client can also provide autocomplete support for Keycloak roles to simplify the configuration of access permissions within Fabasoft app.telemetry.
Fabasoft app.telemetry 2018
Software-Telemetry Research View
The Software-Telemetry Research View implemented in Fabasoft app.telemetry 2018 supports the identification of requests matching complex filter criteria and longer timespans. In contrast to the standard Software-Telemetry Data View, which has been primarily designed for live request view, the Research View handles a dataset of (up to 10000) requests which is calculated on demand and can be sorted appropriately. The calculation of the dataset is done on request, asynchronously and can be interrupted, so the user has full control of the calculation and no more client timeouts may occur during calculation due to long running queries. The compulsory need of specifying the period of time to search in, allows to influence the duration of the query directly and helps avoiding long running queries. The analysis of single requests is available as well in the Research View as in the Data View. Navigation to the Requests from the Request Statistics view and the Request Categories view will lead to the new Research view to support the analysis of larger datasets.
Apache HTTPD Configuration on CentOS 7
In case you have customized the Apache HTTPD configuration for app.telemetry in /etc/httpd/conf.d/apptelemetrywebserver.conf it may be necessary to review the Fabasoft app.telemetry Webserver configuration file in /etc/httpd/conf.d/apptelemetry.conf to reapply your customizations.
Services need to be manually started after the installation on CentOS 7
On CentOS 7 app.telemetry services will no longer be started immediately after an installation to improve support for installations in systems that are not fully running (such as for example during an automated kickstart installation). Since you need to run the /opt/app.telemetry/bin/serversetup.sh script after an installation of a Fabasoft app.telemetry Server you will not notice a difference there. Fabasoft app.telemetry Agent installations on the other hand require a manual start of the app.telemetry Agent (or a system reboot if you prefer that).
Fabasoft app.telemetry 2016
Agent Counters
In order to trigger status events in case of an invalid agent time status, additional counters are available from the “Server Statistics Counter” plugin under the agent object, which reflect the values of the agent view.
The “Time Drift (ms)” counter represents the absolute value of the time difference between host machine of the app.telemetry server and the host machine of the selected app.telemetry agent in milliseconds. In some environments (e.g. when using Kerberos authentication) it is essential to keep the time drift between machines within a small range (< 5 seconds). With the new counter you can set warning or error limits to get informed when the time difference between servers is out of the valid band.
The “RTT (ms)” counter represents the time in milliseconds it takes to send a simple request to the selected agent and receive the answer. The time depends on the quality of the network connection and the load of the systems involved.
SSL Connection information in nginx Module
In order to track the quality of the SSL encryption, the SSL Version and SSL Cipher property is logged for SSL connections.
In addition the remote port property is reported to allow identifying http connections based on the remote port.
Compare Counter Checks with String Values
Some counter (e.g. from SNMP sources) report status values as strings. These strings can be matched with regular expressions to generate a warning or error status.
In the Service Check configuration dialog you can either use the Numeric Ranges to specify a range of critical values as you could do this also in previous versions or you use the new Text Match to specify, which text values should trigger an error. The Pattern is a regular expression to match the value of the counter.
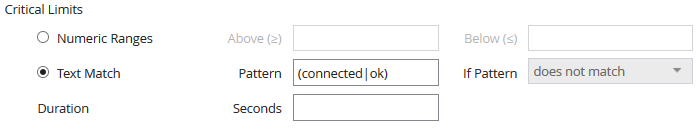
In this example, the counter is reported as an error, if the value is no equal to connected or ok.
The following example will generate a critical status, if the value starts with err.
![]()
Deactivate and Activate Dashboards and Charts
To temporarily avoid the usage of dashboards or dashboard charts, they can now be deactivated by an administrator using the context menu in the configuration mode.
Filter Notifications by source and target status
To avoid notifications, when the status changes between OK and warning, notifications can now be filtered not only by target status but also by source status.

Thus, if only Critical is selected as from and to status filter, then notifications are only sent, when a selected check, service or service group changes to critical or if it has changed from critical to any other status.
Encryption of sensitive parameters in the Infrastructure
There are several password or passphrase parameters required for service checks, database connections. On order to safely store these parameters they are now encrypted using an RSA key so they are not readable in the infra.xml. The encryption keys are generated automatically by the app.telemetry server. Make sure to create a backup of the key pair encryption.(key|pem) located under /etc/app.telemetry/server/ or C:\ProgramData\Fabasoft app.telemetry\server\ to allow the server to decrypt the messages in case of restoring the infra.xml on another system.
Instrumentation extended in nginx module
SSL Version and SSL Cipher were added as parameters of the nginx softwaretelemetry module.
Additional customization options in feedback forms
Some additional options have been implemented to allow further customization of your feedback dialogs. Choose your own fonts, define the border radius and shadow of the form and the buttons and hide the copyright text to adapt the feedback dialog to your website design.